Conclusion: The long term impact of debt-to-GDP over 90% is protracted periods of below average economic growth with a meaningfully negative impact on cumulative GDP.
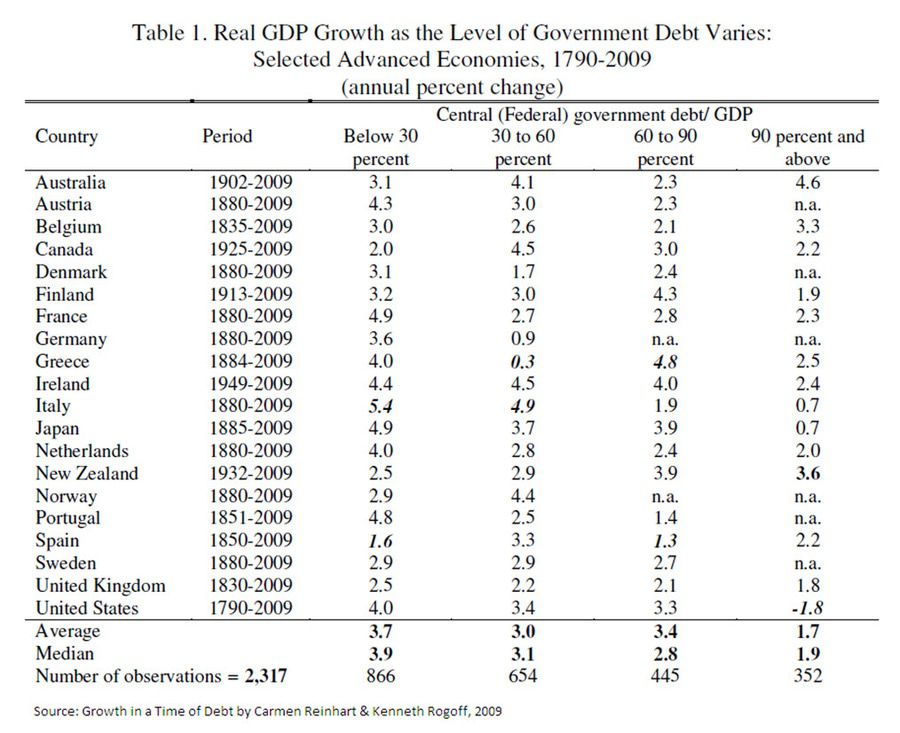
We often write about the impact of debt-to-GDP north of 90% and its detrimental impact on growth. This ratio and level was popularized by Carmen Reinhart and Kenneth Rogoff in their seminal work, “This Time Is Different: Eight Centuries of Financial Folly.” In their research, Reinhart and Rogoff analyze over 200 years of data from a group of more than 60 advanced economies. The results are summarized in the table below, but the key takeaway is that at or north 90% debt-to-GDP, of which there are 352 observations, economic growth slows to 1.7% on average versus 3.4% growth on average at lower debt levels.
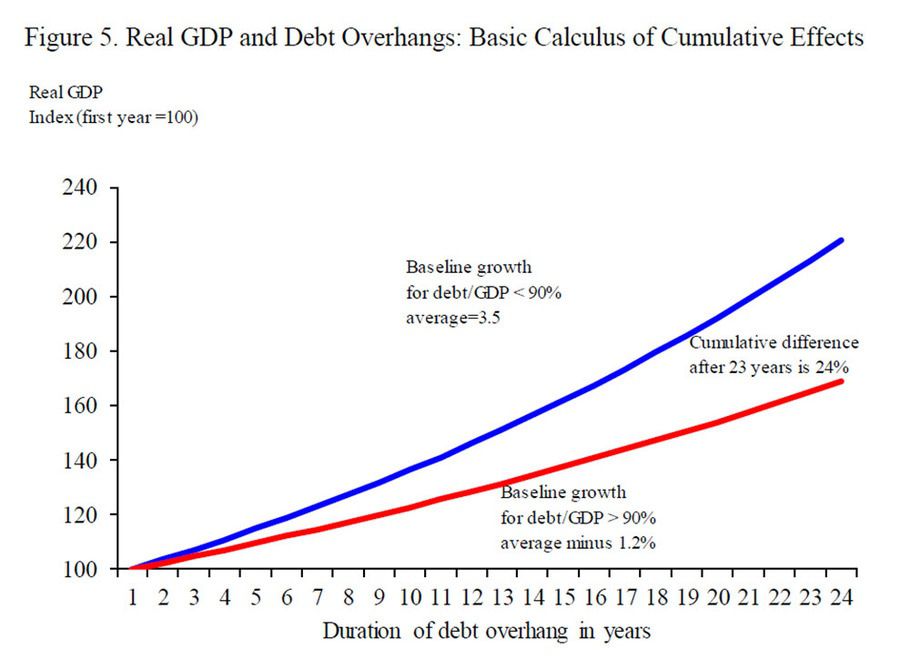
In a subsequent paper published last month, Reinhart and Rogoff consider the impact of longer term periods in which debt-to-GDP remains above 90%. They define these as “debt overhangs as economic episodes where the gross public debt / GDP exceed 90% for five years or more.” In their research, Reinhart and Rogoff identify 26 debt overhang periods in 22 countries going back to the early 1800s. This data currently excludes the unfolding cases of Belgium, Iceland, Ireland, Portugal, and the United States.
Not surprisingly based on Reinhart and Rogoff’s prior work, periods of debt overhang lead to below trend line economic growth for extended periods. In fact, of the 26 observations of debt overhang periods, only three observations resulted in above average growth (Belgium from 1920 – 1926, Netherlands from 1932 to 1954, and the U.K. from 1830 to 1868). Collectively, the average growth for debt overhang periods is 2.3% per annum versus 3.5% per annum for period in which debt-to-GDP is below 90%.
Clearly, then, economies with more debt grow at a slower pace, but the more concerning issue is the cumulative impact. The average duration of a debt overhang period is twenty-three years. If we extrapolate the impact of 1.2% growth per annum over twenty-three years, the cumulative impact is substantial. In this paper, Reinhart and Rogoff use a baseline analysis and show that at the end of the average debt hangover, real GDP is 24% lower than in periods where debt-to-GDP is below 90%.
Interestingly, as the chart below highlights, the current period may shortly become the most indebted period of the last century. The chart shows gross public debt-as-a-percentage-of-GDP for 70 advanced and emerging countries. The 22 nations considered advanced economies are, in fact, at their most indebted ever and exceed the indebtedness of the emerging markets by a ratio of greater than 2:1. Logically, then, we may be entering the most meaningful and lengthy debt hangover in modern economic history.

The common refrain from many who support more aggressive government spending and higher government debt levels is that interest rates continue to allow funding. In effect, if markets are not concerned about solvency risks, why should policy makers care? Firstly, they should care because of the impact to long-term growth. Secondly, in 11 of the 26 examples of debt overhang, real interest rates were lower, and therefore did not prove an adequate predictor of future economic performance, or risk.
In a typical hangover scenario, we’d recommend comfort food, vitamins and a lot of water. The more realistic scenario for nations experiencing a debt hangover is to endure the short term economic pain of reducing government debt. As we are seeing in Europe though, in a highly politicized world that is often easier said than done.
Daryl G. Jones
Director of Research