Survey Says: 382k Jobless Claims = S&P 500 1,335
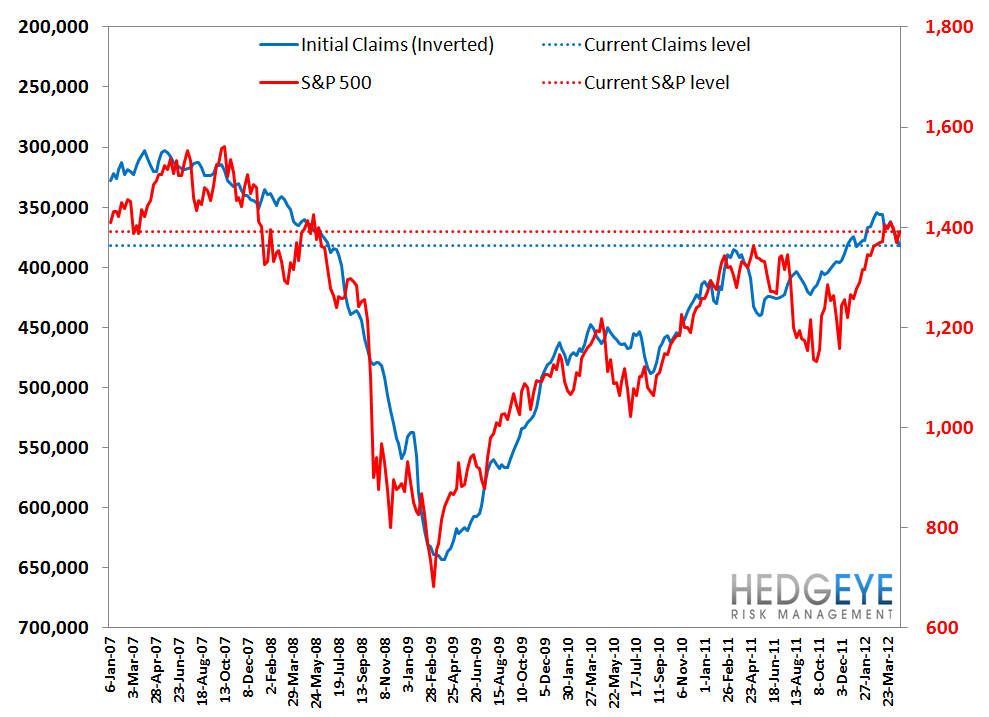
Initial jobless claims were 388k this past week, marking the third week in row at roughly that level (388k, 389k, 388k). The print was technically down 1k from last week's 389k, but that's after last week was upwardly revised by 3k. Apples to apples, it was up 2k vs. the prior week. This brings the trend in the rolling series to 382k, a 6k increase over the prior week. These results are bad, quite frankly. For reference, rolling initial claims bottomed at 354.75k on Feb 24, 2012. In the last two months, rolling claims have risen by 27k, or 7.7%. Ordinarily, that would be good for a commensurate decline in the market, but the strength of Apple's earnings seem to be keeping the market propped up for now.
We continue to expect weakness in this claims series for seasonal reasons as we move into the summer months with claims likely peaking in the July/August timeframe. As such, we would expect the market's vulnerability to external shocks like Spain, Iran and other factors to increase in the face of weakening domestic data. For more on this, see our recent note entitled: "Why History Keeps Repeating (Or At Least Rhyming)".
For reference, based on the chart below, which demonstrates the cointegration of the S&P 500 with claims, fair value on the market based on rolling claims at 382,000 is 1,335 (vs. ~1,390 currently).


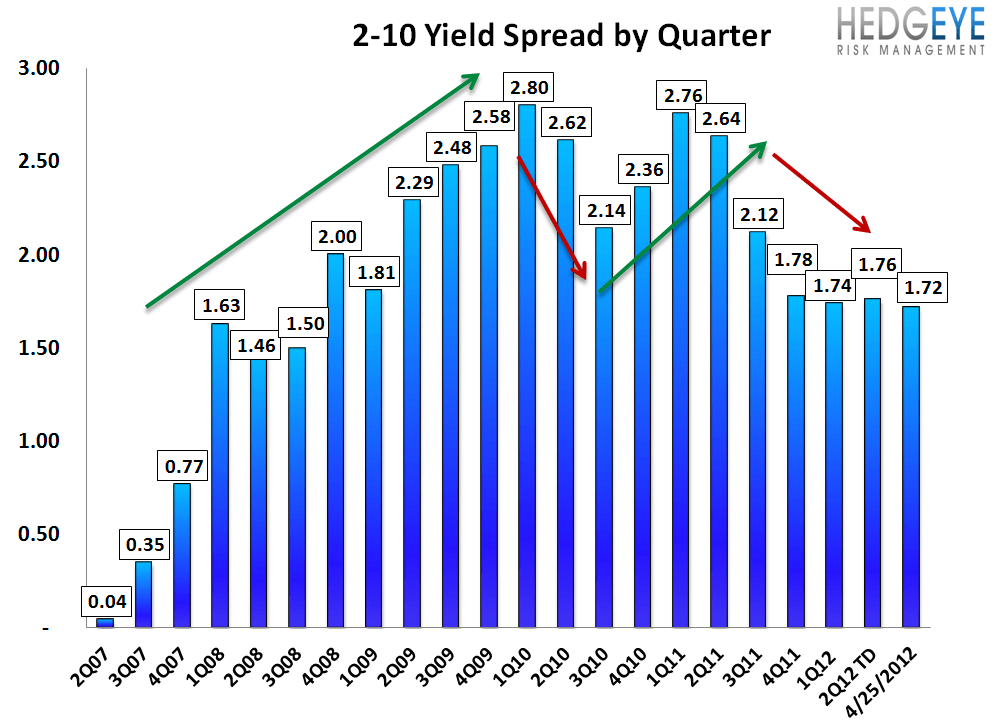
2-10 Spread
The 2-10 spread widened less than a basis point versus last week to 172 bps as of yesterday. The ten-year bond yield increased 1 basis point to 199 bps.

Financial Subsector Performance
The table below shows the stock performance of each Financial subsector over four durations.

Joshua Steiner, CFA
Allison Kaptur
Robert Belsky
Having trouble viewing the charts in this email? Please click the link at the bottom of the note to view in your browser.
