I have re-purposed the following note from the Healthcare team headed up by Tom Tobin. While the note is Healthcare-centric, the implications from a broader market perspective are obvious given what the country experienced last year when Washington ground to a halt under the weight of this topic. It seems clear that the Debt Ceiling Debate is a topic that had a significant impact on businesses and consumers last year but has been off the radar screen for some time. Now it seems, it is coming back into focus.
Last weekend, Treasury Secretary Timothy Geithner said that the U.S. debt ceiling (now $16.4 trillion) will probably be reached by the end of 2012. The analysis of the Hedgeye Healthcare team, copied below, suggests that the debate could resurface sooner than that, perhaps even before the presidential election in November.
The following is the note from the Hedgeye Healthcare team:
CONCLUSION: Under reasonable growth and spending assumptions for the balance of the year, we’ll be very close to hitting the debt ceiling by November. A repeat of the 2011 debt ceiling spectacle would serve as an acute liability to Obama’s re-election bid, a headline risk to healthcare equities, and a prospective intermediate & longer-term negative for growth of the health economy. Below we compared the latest budgetary projections against the current trajectory for federal revenues and outlays to assess the probability of another debt ceiling breach ahead the November election.

Last year’s debt ceiling debate, which began in 1Q11 and steadily escalated to full contentious crescendo into the signing of the Budget Control Act (BCA) on Aug. 2nd, had broad social & economic impacts. Job Growth, Consumer confidence, & Obama’s Approval rating all declined as uncertainty accelerated in July & August. Markets treaded water with a bias lower through that 2Q11 uncertainty before breaking to the downside in the wake of S&P’s downgrade of U.S. Credit on August 5th following Obama’s signing of the BCA.
While the existent macroeconomic and Eurozone debt dynamics played a part in the movement of the metrics described above, at its peak, the debt ceiling captured the bulk of domestic headlines and certainly served as a lead catalyst driving populous sentiment and market price action.
Below we compared the latest budgetary projections against the current trajectory for federal revenues and outlays to see if a pre-election replay of the debt ceiling debate was either possible or probable.
The accounting identity describing the monthly federal fiscal condition is a simple one for the Treasury Department: Outlays – Receipts = Deficit This identity simply equates total deficit spending with the difference between Revenues (estimated but unknown) and Spending which predominately comes in the form of Entitlement Spending (estimated but unknown) and Budgeted Outlays (largely fixed). With some minor exceptions, deficit spending finds its way to the Federal Balance sheet as a commensurate increase in total Public Debt.
Taking each equation constituent in turn – starting with inflows via Social Insurance and Individual & Corporate Income tax receipts.
Revenues:
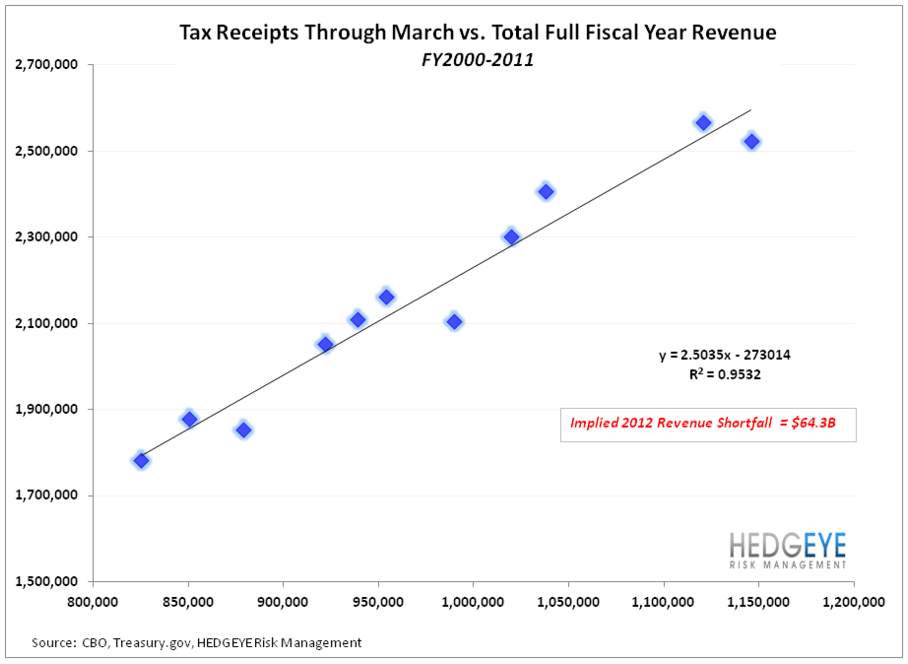
As we highlighted in yesterday's HEALTHCASTER, revenue totals through March have been a strong predictor of total fiscal year revenue with an R^2 = 0.95 going back to 2000. Given total federal tax receipts through March of the current fiscal year, implied full year revenue will come in at $2.391T, or ~$64B short of the CBO’s latest March Projection of $2.456T.
Looking at the temporal pattern in revenue run rate over the last few years tells a similar story. For the years 2009 – 2011, on average, we have collected 45% of total fiscal year revenue thru March. In 2012, we have only collected 43.3% of total CBO estimated revenues. This means that either we will play catch-up via a back half economic acceleration, or revenue estimates remain too high. If current revenues through March, in fact, equal the recent historic average of 45% of total fiscal year revenue, implied full year 2012 revenue would be $2.357T, or some $99B below current estimates.
The conclusion that the U.S. is likely to realize a revenue shortfall also appears probable after analyzing of the growth & Inflation assumptions embedded in the CBO’s projections for the balance of fiscal 2012.
The CBO currently estimates nominal GDP growth will average 3.61% y/y through the balance of the fiscal year. With quarterly inflation estimates averaging ~1.4%, this implies real y/y GDP growth of 2.3% for Fiscal 2012. Given that real y/y GDP growth hasn’t eclipsed 1.6% in the last three quarters, and against our macro teams expectation for decelerating economic growth, these growth assumptions appear overly optimistic. If, instead, real GDP growth averaged 1.1% for the balance of the fiscal year, the implied revenue shortfall would be ~$40B (still using the CBO’s estimate for Revenue as a % of GDP).
Lastly, Treasury data shows Total Withheld income and Employment taxes up 4.7% through March vs 2011. While positive, growth in tax withholdings lags the forecasted 6.6% growth in tax derived federal revenues.
Revenue Conclusion: The current rate of tax collections and overly optimistic growth assumption for federal revenue both suggest full year tax receipts will come in below existing projections. This is an obvious negative assuming that revenue gap is filled via larger debt funded deficit spending.
Outlays:
We took a couple approaches in estimating where total deficit spending to could finish to close the year.
In a first scenario, we simply extrapolated the current treasury issuance run rate for the balance of the fiscal year. For the fiscal YTD (thru March) there have been 123 working days in which we accumulated $779B in deficit spending - equating to $6.33B in debt funded deficit spending per day. Extrapolating that same rate out over the rest of the fiscal year (127 working day) results in an additional $804B in deficit spending. Admittedly, this doesn’t account for annual variance in the roll-over schedule due changing maturity profiles. This scenario also implies total deficit spending of some $1.583T for the year which would be a new record, exceeding 2009’s record total by ~$167B and exceeding the current 2012 estimate of 1.2T (current CBO estimate) by over $300B.
Secondly, and similar to the analysis on revenues, we looked at the recent historical temporal pattern in debt issuance. On average, over the past three years, 58.2% of total issuance has occurred thru March of the given year. The $ 779B of deficit spending through March of this year would represent 66.5% of spending if the CBO’s estimate of 1.17T in total deficit spending for fiscal 2012 is indeed accurate. If, however, the current $779B in deficit spending were to equal the recent historical average of 58.2%, implied full year deficit spending would equal $1.34T, $167B above current estimates.
Spending Conclusion: As opposed to the revenue side of the equation, it’s more difficult to make a highly cogent case for a large delta in outlays vs existing estimates. Consumption & Acuity of Medical care is stable but not showing significant upside which decreases the odds for an outlier move across the Medicare & Medicaid cost lines.
Uncertainty still exists around the costs associated with the payroll tax extension which includes the extension to unemployment benefits and another temporary Medicare doc fix. CBO originally estimated the net cost at $100-150B and issued a final score with a net cost of ~$101B for FY 2012, which may ultimately prove conservative.
The Outlays scenario’s outlined above suggest spending estimates may be marginally too low, and with political shorterm-ism supporting spendthrift policy and CBO’s strong track record in underestimating outlays and deficit spending, we think the balance of evidence points towards spending that is flat to marginally higher than current projections.
Where Do We Stand Currently:
As of the end of march, total public debt stood at $15.539T against the legislated limit of $16.394T - leaving $855B available before breaching the debt ceiling. Taking the above dynamics into consideration, below we show the prospective timeline for the debt ceiling breach under 3 scenario’s of ranging aggressiveness.

CONCLUSION:
High Impact Event catalysts with the ability to influence election outcomes and subsequent policy initiatives are of obvious importance to industry stakeholders and market participants. For healthcare, the current political and ideological differences between parties regarding the structure of the health economy and delivery of care are stark, with the potential for divergent trajectories for medical spending growth depending on who controls the White House post November.
Our view remains that the prospective coverage expansion, increased public subsidization of medical care, and generally benign Entitlement reform expected under an Obama second term would auger positively for growth of the healthcare economy relative to the prospects under a GOP administration. And while the health legislation & Entitlement proposals proffered by Ryan, and supported by Romney, may, in practice, have little negative impact to the current status quo over the intermediate term, the headline risk for healthcare equities is likely to be real and the longer-term growth prospects for the health economy comparably worse.
While it’s difficult to pin down a definitive timeline for a breach of the debt ceiling, especially given the fund shifting & other accounting maneuverability available to the treasury to extend the timeline, under reasonable growth and spending assumptions for the balance of the year we’ll be very close to hitting the ceiling by November - certainly close enough for the GOP to hold the dialogue hostage to that point if they choose.
A repeat of the 2011 debt ceiling spectacle would serve as an acute liability to Obama’s reelection bid, particularly if employment growth remains lackluster and the profligate, deficit funded federal spending of the last few years continues to (arguably) fail in its attempt to drive a broad & meaningful economic recovery.
SOME ADDITIONAL THOUGHTS:
April is an important barometer month for revenues given the tax deadline, and the post April numbers offer a somewhat clearer picture of the revenue-spending balance as a full accounting of tax refunds can be netted against tax receipts. The Treasury’s monthly budget statement is scheduled for release on May 10th.
Below is a list from Reuters, compiled in 2011, of the temporary programs the treasury can engage in to extend the debt ceiling timeline. As we saw in 2011, Geithner et al. are unabashed of using any & all available maneuvers to put off d-day.
ISSUE MORE CASH MANAGEMENT BILLS
The Treasury could cut issuance of longer-term government debt and rely more heavily on short-term cash management bills to gain more day-to-day control over debt outstanding. Cash management bills are typically issued for days instead of normal Treasury bill maturities of four weeks to one year. However, this is unlikely to buy much time and officials are wary of making any major shifts in the Treasury's debt issuance calendar, which could upset markets.
SUSPEND STATE, LOCAL GOVERNMENT SECURITIES
The Treasury could suspend sales of State and Local Government Series securities, known as "slugs," which are special low-interest-bearing Treasury securities offered to local governments and other tax-exempt entities for the investment
of municipal bond issue proceeds. Slugs, which count against the debt limit, were last halted in September 2007 to avoid hitting the ceiling then.
CIVIL SERVICE RETIREMENT AND DISABILITY FUND
As it has in the past, the Treasury could suspend payments to the Civil Service Retirement and Disability Fund, a government employee pension fund. The government has recently been contributing an average of $5.8 billion to this fund per month. It would be required to replace any missed contributions and lost earnings.
EXCHANGE STABILIZATION FUND
The Treasury could dip into this seldom-used $50 billion fund earmarked to stabilize currency rates. Created during the Great Depression of the 1930s, the fund was last used as a backstop to guarantee money market mutual funds during the worst part of the financial crisis from September 2008 to September 2009.
GOVERNMENT SECURITIES INVESTMENT FUND
To free up cash, the Treasury can halt reinvestment of another federal employee pension fund known as the G-Fund, which had net assets of about $125 billion at the end of 2010 invested in special short-term Treasury securities with maturities of one to four days. Normally, maturing assets in the G-Fund are reinvested daily. But the Treasury has statutory authority to retain a portion of the fund, as long as it provides proper notification and reimbursement for any lost earnings from the move. Such a move could temporarily claw back $122.3 billion in borrowing capacity.
SWAP FEDERAL FINANCING BANK DEBT
The Federal Financing Bank can issue up to $15 billion in debt on behalf of other government agencies that is not subject to the debt limit. So the Treasury could exchange FFB debt for other debt to reduce the total amount subject to the limit.
ACCELERATE ASSET SALES
The government could raise money by selling off chunks of companies it bailed out under its $700 billion Troubled Asset Relief Program. However, Geithner said this was not a viable option because taxpayers could end up suffering losses from a "fire sale" of financial assets. He also said selling U.S. gold could undermine confidence in the United States.
Thomas W. Tobin
Hesham Shaaban, CFA
Christian B. Drake
