Underlying Trends in Athletic Apparel & Footwear appear healthy, though the 1-year comp will suggest otherwise in the coming weeks. NKE continues to gain share across several major categories in both FW & Apparel. FINL and NKE both remain among our favorites.
<chart12>
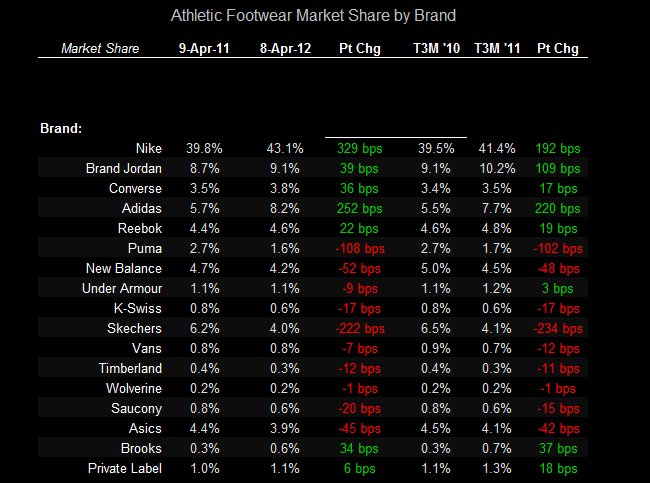
Footwear:
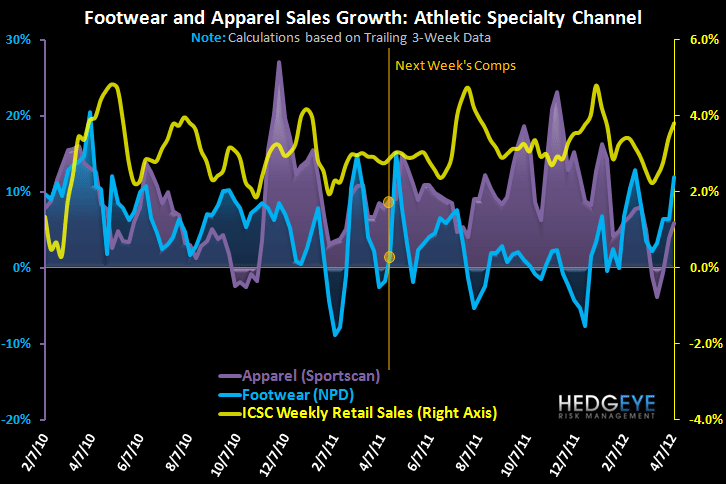
Footwear sales were up ~22% last week driven almost entirely by volume; units were +21% with ASP +1%. Last week’s outperformance does reflect the tailwind from the Easter shift however the acceleration on the margin from the prior week is notable. Sales were up 4% prior to last week and grew ~18 points sequentially (to +22%) despite the industry comp increasing from (-13%) to +12%.
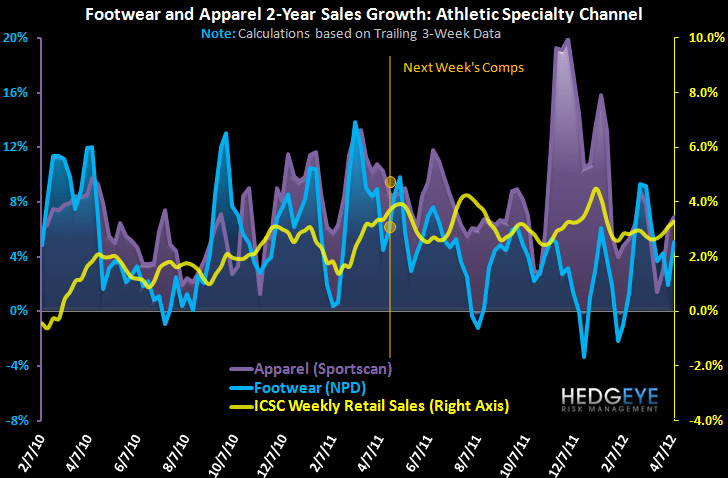
Beginning next week, the Easter tailwind will fade into a headwind as the industry starts to comp the weeks last year that led up to Easter weekend (4/24/11). If we assume underlying 2 yr trends remain flat, we would expect a sharp deceleration in sales down to flat to +LSD. In addition, next week’s results will include Easter (little to no spending) compared with last year which excluded the Holiday and should begin to show the seasonal spend leading up to the holiday weekend. The Footwear market has remained healthy through March and started April strong but is now approaching the Easter shift headwind. NKE (inc Brand Jordan & Converse) as well as ADIBok have been gaining share from the rest of the industry. UA lost 9bps of share last week preventing its market share from breaching the 1.1% threshold.
Apparel:
Unlike Footwear, Athletic apparel sales slowed last week reflecting less favorable comps which won’t fade until after Easter. Beginning next week, we expect to see a more pronounced negative impact in athletic apparel top line results from the 2012 Easter shift (4/8 this year vs. 4/24 last year). As such, we will continue to assess the health of the athletic apparel industry using underlying trailing 3 week and 2 yr growth rates. Over the past 4 weeks, we’ve seen sequential improvements in these trends within the athletic specialty channel. Should these rates remain flat as the industry laps the holiday shift, we expect year over year growth within the athletic specialty channel to be down LSD-MSD next week which will not accurately reflect top line momentum.
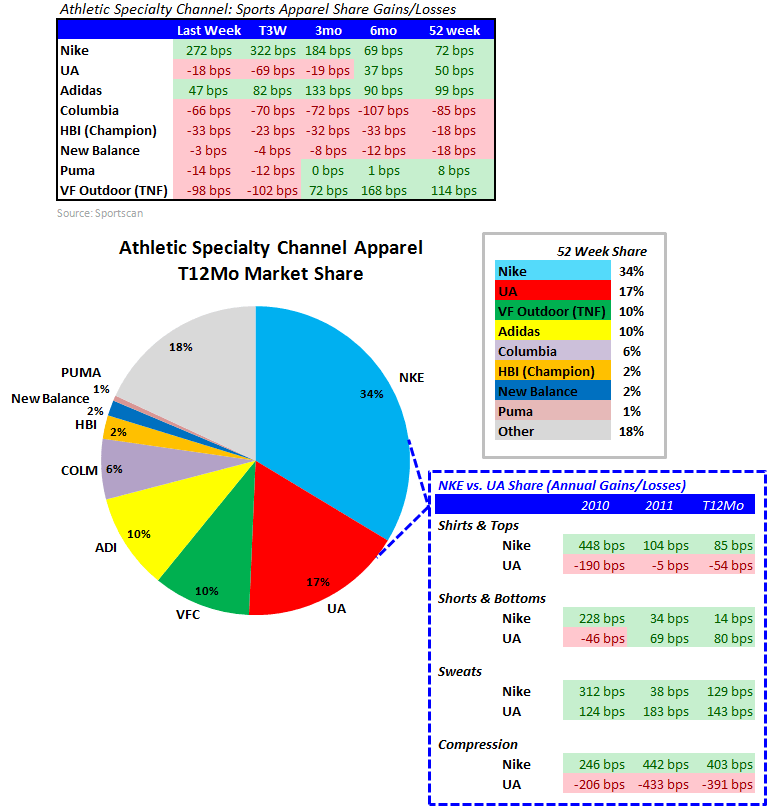
Over the past 2 months, strength in apparel within the athletic specialty channel has been consistently driven by NKE who has gained ~1pt+ of share per week. Alternatively, Under Armour has been losing market share. In order to identify where NKE has been gaining share, we analyzed four key categories below within the athletic specialty channel where NKE & UA combined account for ~60%+ of the domestic market.
- Both NKE and Adidas have consistently gained share across the 5 durations below. UA has started losing share over the past 3 months - at the same time NKE’s gains have accelerated meaningfully.
- In the Shirts/Tops Category, NKE’s share is 43% vs. UA’s 29%. In this category, NKE has been gaining share over the past 2 years while UA has been losing. Based on the graph below, while the 28% of the industry classified as “other” has had an impact on changes in share with sales up +7%, UA’s losses over the past 5-months reflect NKE’s sales growth up +11% outpacing UA, which has been essentially flat.
- Nike has 47% share of the bottoms category while UA only has ~11% share. The tradeoff in share is less pronounced here - while NKE has gained share over the past couple of weeks, it seems to be primarily from the “other” companies, though UA’s gains have decelerated.
- Under Armour’s “Storm Fleece” platform is classified primarily as “sweats;” UA holds 28% share of the category vs. NKE at 47%. UA has been losing share here, down ~350 bps over the past couple of weeks, however the 27% of the industry classified as “other” has lost significantly more share. NKE has gained over 6 pts of share YTD with sales up +48% over the past 5 months, outpacing UA (+42%), and Other (+27%).
- NKE and UA account for 95% of the compression category (27% & 68% respectively). In this category, (see chart below), major gains and losses in share do indeed come at the loss of either UA or NKE as a result. Note that NKE has been gaining 200bps+ in share over the past 2 years while UA has been losing that amount. Category sales are up +3% with NKE up +19% and UA down 1%.
It appears that the categories where NKE is in fact taking direct share from Under Armour are the shirts/tops & compression categories.
A key consideration here is that with the mid-teens US Futures growth we’ve seen out of Nike over the past quarters, we NEED to see these levels of share gains. We KNOW the product was ordered, and we KNOW the product is hitting shelves and needs to be sold. That’s why we pay particular attention to the ASP – a weak ASP would indicate that the goods needs to be heavily discounted to move off the floor. But that’s not the case. In fact, Nike’s trailing 3-week change in average price point is better than 10%. Trends appear on track here.
Matthew Darula
Analyst