An easy hold comparison aided March but Mass strength is the key takeaway
On an hold adjusted basis for both periods, March GGR would’ve grown 21% YoY versus the 25% actual. VIP hold was close to normal this year but last year's was below. For the 5th straight month, Mass growth outpaced VIP, a good signal for profits. March was the easiest hold comparison of the year so the next few months should be more indicative of the real pace of growth.
Y-o-Y Table Revenue Observations
Total table revenue grew 25% YoY this month, on top of 48% growth last March. Hold comparisons were again very easy. Mass revenue grew 41% while VIP revenue grew 21%. Junket RC increased 15%.
LVS
Table revenues grew 34% YoY, outpacing the market due to a strong performance from Four Seasons. For the 5th consecutive month, LVS had the silver prize for VIP growth, after Galaxy.
- Sands was up 16% YoY with a very low hold comparison of 2.2%
- Mass and VIP both grew around 15%
- Assuming $300MM/month of direct play or 12% (in-line with the monthly absolute average in 4Q11), hold was 2.95% vs. 2.20% last March, assuming 10% direct play or $282MM/month
- Junket RC was down 15%, the 3rd consecutive double-digit decline
- Venetian table revenues increased 21% YoY, driven by easy hold comps and good growth in Mass
- Mass increased 49%, VIP increased 21%, while junket VIP RC increased 1%
- Assuming 27% direct play in the quarter (below the 28% we saw in 4Q11 but higher than 2011), hold was 2.52% compared to 2.19% in March 2011, assuming 19% direct play (in-line with 1Q11)
- Four Seasons skyrocketed 129% YoY, driven by huge Junket RC growth and high hold
- Junket VIP RC and VIP revenues were both up triple digits. Mass grew 14%.
- Four Seasons is clearly seeing a benefit from LVS’s recent initiatives. If we assume that monthly direct play volume of $690MM/month in-line with 4Q11, that implies a direct play percentage of 18% for March and a hold rate of 3.04%. In comparison, if March 2011 direct play was around 50% (54% in 4Q10 and 40% in 1Q11) then hold was 2.55%.
WYNN
Wynn table revenues increased 11%, continuing its sub-market growth for 8 consecutive months. While Wynn’s hold was low, last year’s comparison was also easy.
- Mass was up 7%, slowest growth since March 2010, and VIP increased 11%
- Junket RC grew 20%
- Assuming 11% of total VIP play was direct (in-line with 4Q11), we estimate that hold was 2.31% compared to 2.48% last year (assuming 10% direct play – in-line with 1Q11)
MPEL
MPEL grew 27%, propelled by a big rise in Mass table growth of 84%, only behind Galaxy's. VIP revenues gained 11%.
- Altira revenues gained 11% due to a 36% gain in Mass
- VIP revenues rose 9%
- VIP RC fell 15% - marking the 4th consecutive month of declines
- We estimate that hold was 3.3%, compared to 2.6% in the prior year
- CoD table revenue was up 36%, driven by 93% growth in Mass and 19% growth in VIP
- Junket VIP RC fell 18%
- Assuming a 16% direct play level, hold was 3.0% in March compared to 2.1% last year (assuming 13.7% direct play levels in-line with 1Q11)
SJM
Table revenues fell 2%, the 1st decline since July 2009, due to a 7% drop in VIP revs
- Mass rose 11%
- Junket RC was down 5%, the 2nd consecutive month of declines. Hold was 2.66%, compared with 2.73% last March.
GALAXY
For the 10th month in a row, Galaxy posted table revenues growth north of 100% - at 121%. Mass soared 291%, while VIP grew 100%.
- StarWorld table revenues grew 16%
- Mass grew 54% and VIP revenue grew 14%
- Junket RC grew 17%
- Hold was high at 3.0% but in-line with last March's hold
- Galaxy Macau's total table revenues hit $314MM and higher than the 6-month run rate of $279MM
- Mass table revs hit a new monthly high of $77MM
- VIP table revenue increased 18% MoM to $237MM
- Hold was 3.0%
- RC volume of $7.9BN was 8% higher than February's and compares to a peak of $8.3BN in October
MGM
Table revenues grew 14%
- Mass revenue growth of 36% rebounded from February's low of 4%
- VIP revenue grew 8%
- Junket RC grew 9%
- Assuming a direct play level of 9% (comparable to 4Q), we estimate that hold was 2.93% this month vs. 2.97% in March 2011
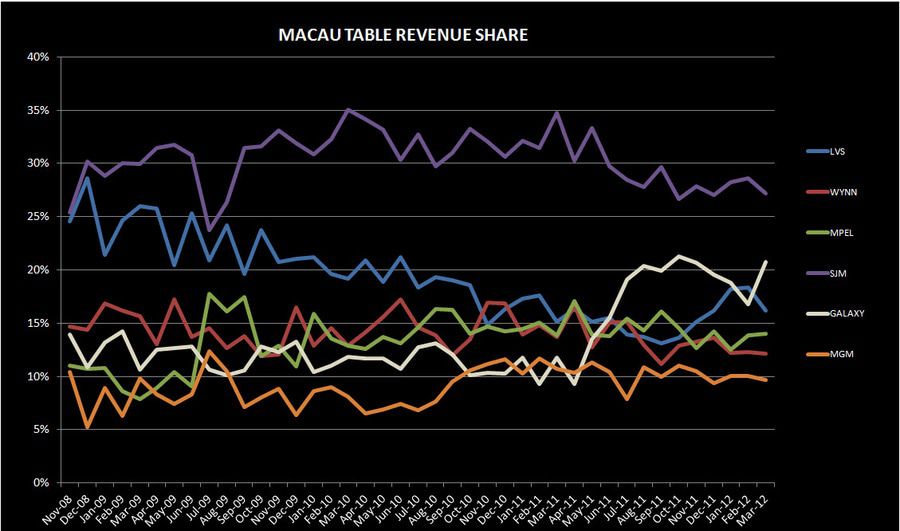
Sequential Market Share
LVS
LVS lost 2% market share MoM to 16.5% in March from 18.5% in February. This compares to a 6 month trailing market share of 16.2% and 2011 average share of 15.7%.
- Sands' share gained 20bps to 4.4%. For comparison purposes, March's share was below 2011's share of 4.6% but above 6M trailing average share of 4.1%.
- VIP rev share decreased 10bps while Mass share gained 80 bps
- RC share increased 70bps to 3.0%
- Venetian’s share dropped 0.3% to 7.7%, the lowest market share in 7 months. 2011 share was 8.4% and 6 month trailing share was 8.4%.
- VIP share decreased 0.9% to 5.0%, lowest share since Aug 2011
- Mass share improved 1.0% bps to 14.9%
- Junket RC fell 60bps to 4.1%
- Four Seasons dropped 2.1% in share to 4.1%, breaking a 6-month winning streak. This compares to 2011 share of 2.2% and 6M trailing average share of 3.2%. In March, FS's VIP rev and RC share were similar to Venetian's.
- VIP share dropped 2.3% to 5.1%.
- Mass share fell 90bps to 1.5%
- Junket RC lost 170bps to 4.1%
WYNN
Wynn’s share fell 30bps to 12.3%, below its 6 month trailing average share of 12.8% and well below its 2011 average share of 14.1%. We expect Wynn’s share to continue to struggle with the opening of Sands Cotai Central in April.
- Mass market share fell 30bps to 9.1%
- VIP market share fell 10bps to 13.2%
- Junket RC share jumped 1.9% to 15.3%
MPEL
MPEL's share was basically unchanged MoM in March to 14.2%. This is in-line with its 6 month trailing share and below its 2011 share of 14.8%.
- Altira share improved 50bps to 4.6%. The property’s 2011 share was 5.3% and 6M trailing share was 4.4%.
- Mass share ticked up 20bps to 1.6% while VIP share increased 80bps
- VIP RC dropped 50 bps to 5.0%
- CoD’s share dropped 0.4% to 9.4%. Its 2011 share was 9.3% and 6M trailing share was 9.5%.
- Mass market share was unchanged at 11%
- VIP share decreased 60bps to 8.8%
- Junket RC was down 20bps to 7.5%
SJM
SJM lost 130bps of share to 26.6%, below its 6-month trailing average of 27.3% and 2011 average of 29.2%
- Mass market share tumbled 4.3% to 32.3%, a new all-time low
- VIP share fell 60bps to 25.3%
- Junket RC share gained 0.6% to 28.4%
GALAXY
Galaxy was the biggest share gainer in March, gaining 380bps to 20.3% and above its 6-month trailing average of 19.2%
- Galaxy Macau share 180% to 10.5%, matching its previous high in Oct 2011
- Mass share gained 2.4% to 9.6%, a new monthly high
- VIP increased 1.6% to 10.8%
- RC share ticked increased 40bps to 10.4%
- Starworld share grew 2.2% to 8.9%, a little below its TTM average share of 9.1% before Galaxy Macau opened.
- Mass share was flat MoM
- VIP share grew 320bps to 11.1%
- VIP RC grew 0.2% to 11.0%
MGM
MGM share fell 30bps to 10.0%. March share sits below MGM’s 2011 and 6-month trailing average share of 10.5%.
- Mass share ticked up 120 bps to 8.0%
- VIP share fell 80bps at 10.3%
- Junket RC fell 50bps to 9.6%
Slot Revenue
Slot revenue reached $138MM in March, with 16% YoY growth
- As expected, GALAXY slot revenues grew the most with 315% YoY to $15MM
- MGM slot revenues had the second best growth at 21% YoY to $23MM, a new monthly record
- MPEL slot revenues grew 13% YoY to $25MM
- SJM slot revenues grew 1% YoY to $19MM
- LVS slot revenues grew 14% YoY to $34MM
- Wynn continued to be the laggard, falling 11% YoY to $21MM