Modeling the XLF from Claims and MBA Purchase Apps - Looking for 10% Downside
In the chart below, we use initial jobless claims and MBA purchase apps to model the XLF. This multiple linear regression yields an r-squared of .92. We expect that initial claims will rise by roughly 35-40k over the next six months, which implies a decline in the predicted XLF of -10.1%. (This analysis holds MBA purchase applications flat from their most recent reading, a conservative assumption given the CAGR of MBA purchase apps over the last four years is -17%.)

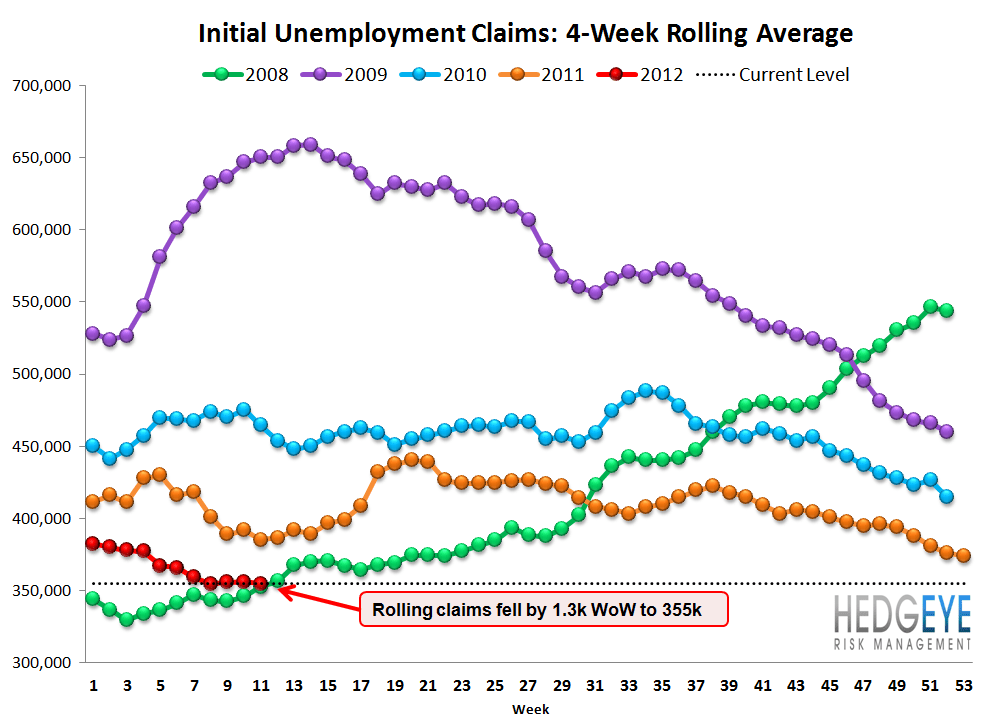
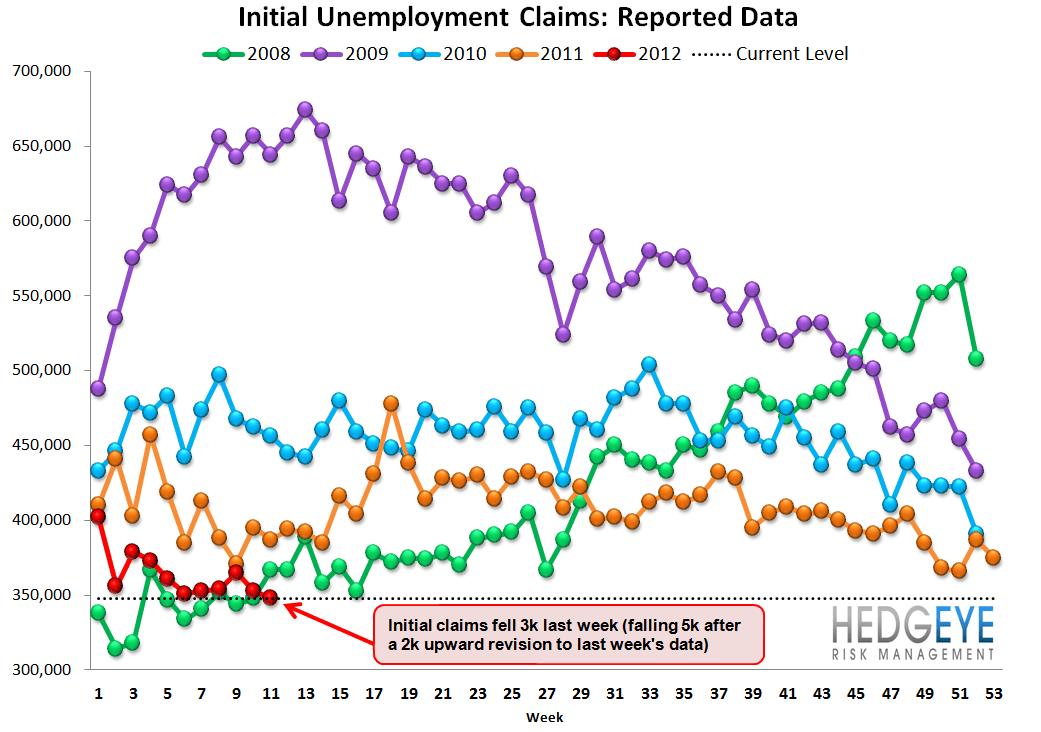
Initial Claims Continue to Show Some Resiliency
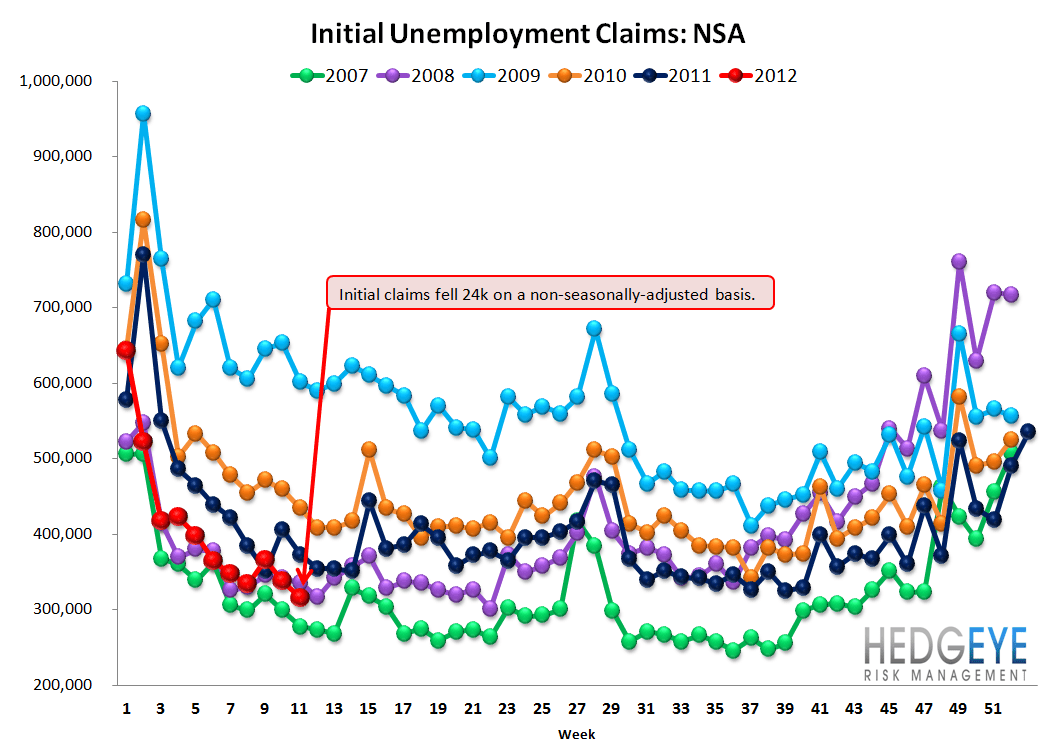
The headline initial claims number fell 3k to 348k (falling 5k after the 2k upward revision to last week's data). Rolling claims fell 1.3k to 355k, while the non-seasonally adjusted series fell 24k to 316k. Rolling non-seasonally adjusted claims fell 7.7k to 338k. We would note the second derivative change in the series in the last three weeks. From the start of the year through week 8, rolling NSA claims were trending lower at a steady clip. However, for the last three weeks they have been moving sideways. This is consistent with our view of expecting to see claims first turn from tailwind into no wind into headwind.


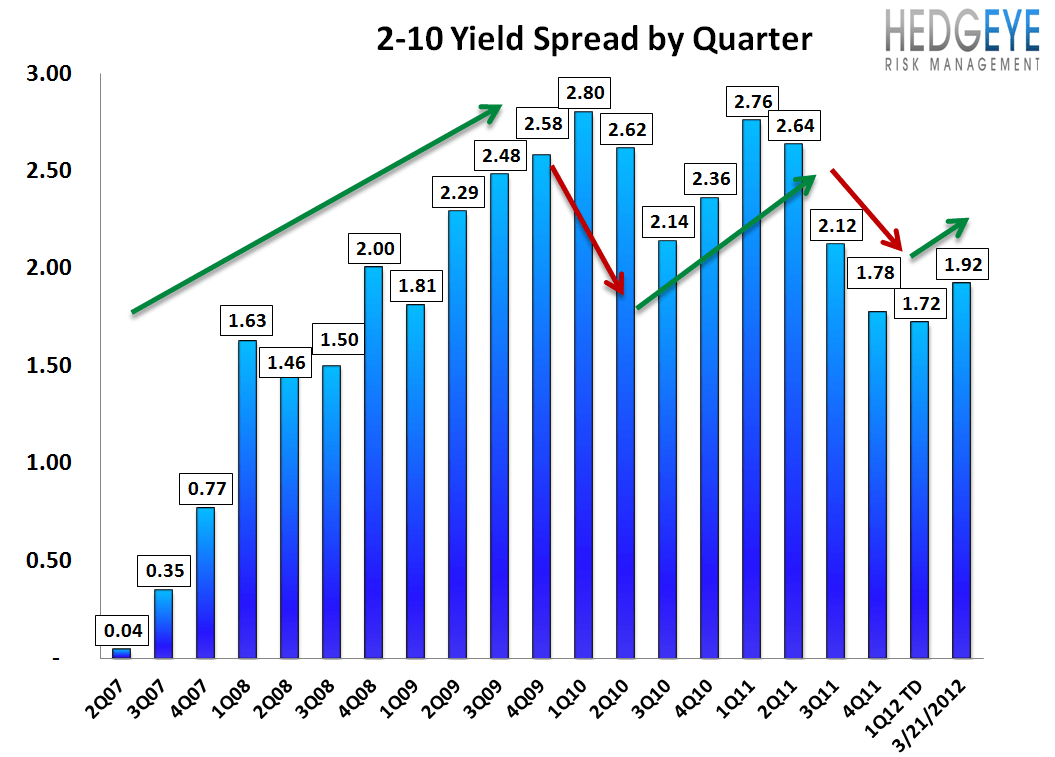
2-10 Spread
The 2-10 spread widened 3 bps versus last week to 192 bps as of yesterday. The ten-year bond yield increased 2 bps to 229 bps.

Financial Subsector Performance
The table below shows the stock performance of each Financial subsector over four durations.

Joshua Steiner, CFA
Allison Kaptur
Robert Belsky
Having trouble viewing the charts in this email? Please click the link at the bottom of the note to view in your browser.