A Look at the Current Setup
* Greece's debt swap was largely in line with expectations last week; on a week-over-week basis, we saw relatively little movement in several key risk indicators. Most of the series were essentially unchanged or continued on their pre-swap trajectories. European and US interbank risk receded further last week with the Euribor-OIS shrinking 4 bps week over week, while the TED spread shrank 2 bps. This is less of a catalyst for further upside now that both of these measures have largely renormalized.
* Both European and American Bank CDS widened week over week.
* High yield rates rose 13 bps off of last week's YTD low, ending the week at 7.01.
* Fairly balanced short-term outlook - Our macro team's quantitative model indicates that on a short term duration (TRADE), there is 1.1% vs. 0.8% downside in the XLF.
Financial Risk Monitor Summary
• Short-term(WoW): Positive / 3 of 12 improved / 2 out of 12 worsened / 7 of 12 unchanged
• Intermediate-term(WoW): Positive / 7 of 12 improved / 3 out of 12 worsened / 2 of 12 unchanged
• Long-term(WoW): Negative / 0 of 12 improved / 6 out of 12 worsened / 6 of 12 unchanged

1. US Financials CDS Monitor – Swaps widened for 19 of 27 major domestic financial company reference entities last week.
Tightened the most WoW: JPM, AIG, CB
Widened the most WoW: MBI, MMC, AGO
Tightened the most MoM: RDN, MTG, AIG
Widened the most MoM: MS, MBI, GS

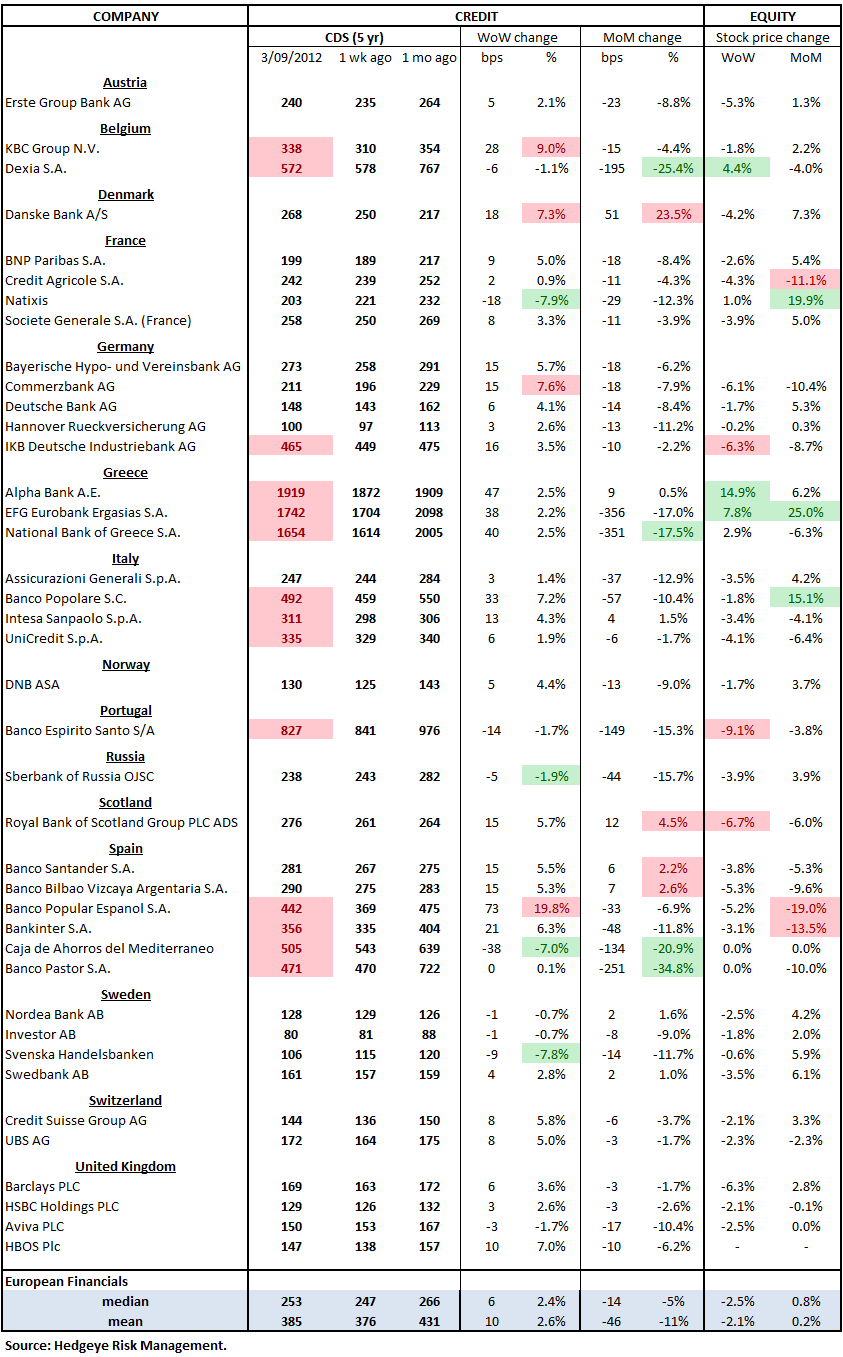
2. European Financials CDS Monitor – Bank swaps were wider in Europe last week for 31 of the 40 reference entities. The average widening was 2.6% and the median widening was 2.4%.
3. European Sovereign CDS – European Sovereign Swaps mostly widened over last week. German sovereign swaps tightened by 2.6% (-2 bps to 77 ) and French sovereign swaps widened by 3.3% (6 bps to 181).


4. High Yield (YTM) Monitor – High Yield rates rose 13.3 bps last week, ending the week at 7.01 versus 6.88 the prior week.

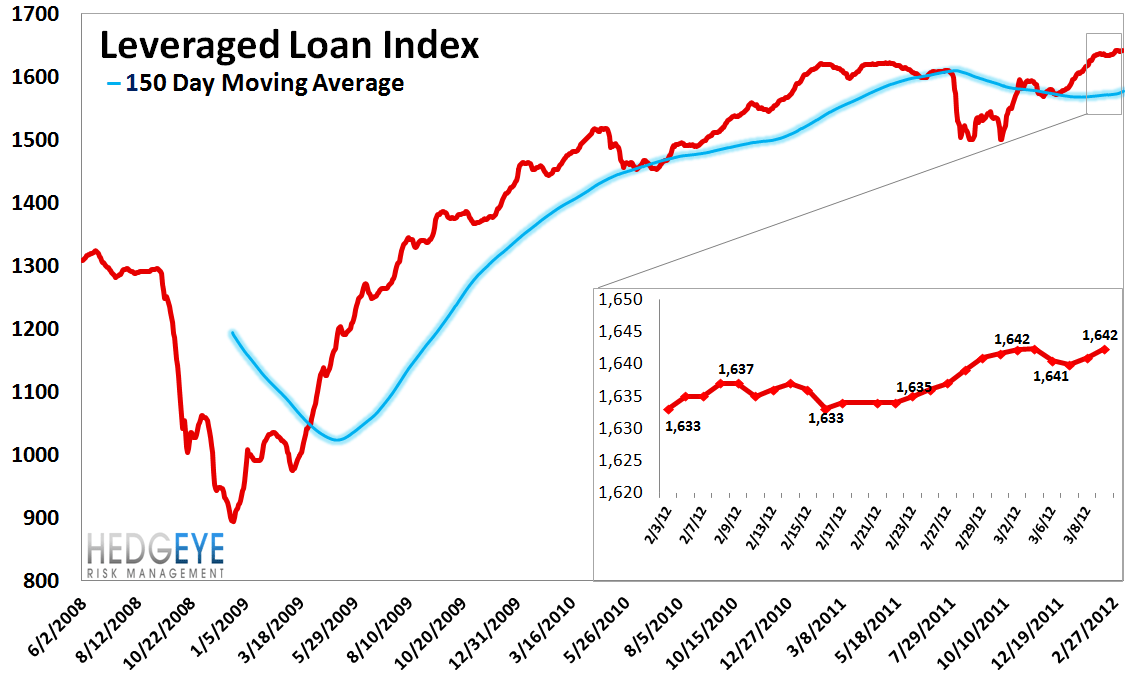
5. Leveraged Loan Index Monitor – The Leveraged Loan Index was flat over last week, ending at 1642.
6. TED Spread Monitor – The TED spread fell 2.3 points last week, ending the week at 39.0 this week versus last week’s print of 41.2.

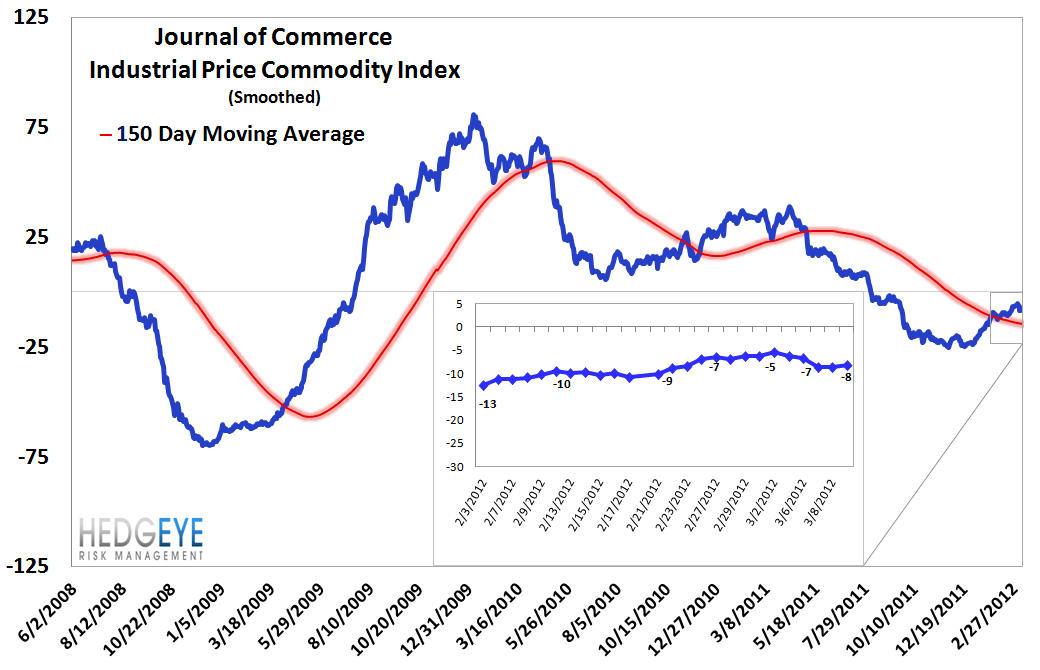
7. Journal of Commerce Commodity Price Index – The JOC index fell 2.7 points, ending the week at -8.12 versus -5.5 the prior week.
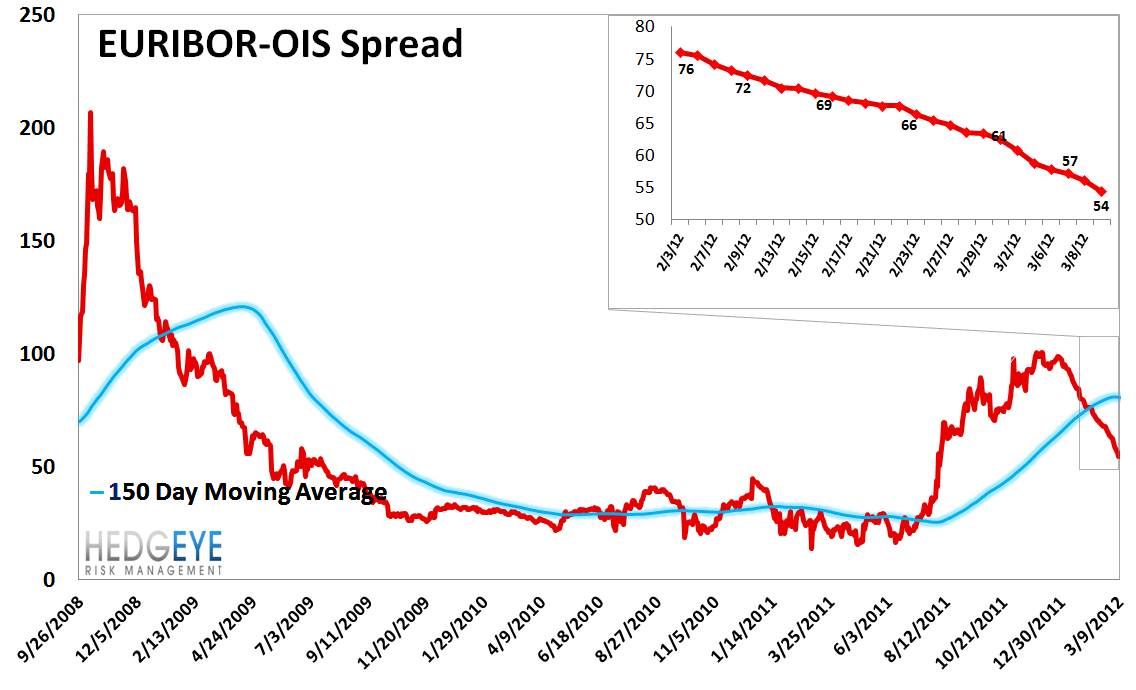
8. Euribor-OIS spread – The Euribor-OIS spread (the difference between the euro interbank lending rate and overnight indexed swaps) measures bank counterparty risk in the Eurozone. The OIS is analogous to the effective Fed Funds rate in the United States. Banks lending at the OIS do not swap principal, so counterparty risk in the OIS is minimal. By contrast, the Euribor rate is the rate offered for unsecured interbank lending. Thus, the spread between the two isolates counterparty risk. The Euribor-OIS spread tightened by 4 bps to 54 bps.
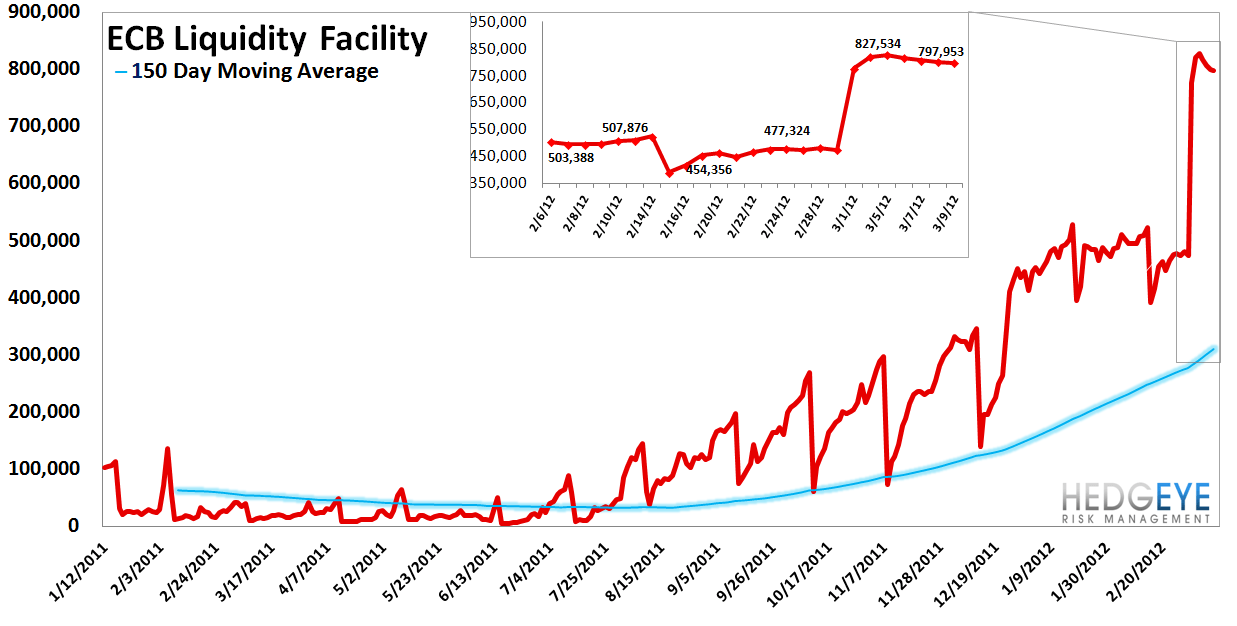
9. ECB Liquidity Recourse to the Deposit Facility – The ECB Liquidity Recourse to the Deposit Facility measures banks’ overnight deposits with the ECB. Taken in conjunction with excess reserves, the ECB deposit facility measures excess liquidity in the Euro banking system. An increase in this metric shows that banks are borrowing from the ECB. In other words, the deposit facility measures one element of the ECB response to the crisis.
10. Markit MCDX Index Monitor – The Markit MCDX is a measure of municipal credit default swaps. We believe this index is a useful indicator of pressure in state and local governments. Markit publishes index values daily on six 5-year tenor baskets including 50 reference entities each. Each basket includes a diversified pool of revenue and GO bonds from a broad array of states. We track the 14-V1. Last week the MCDX was flat, ending the week at 129 bps.

11. Baltic Dry Index – The Baltic Dry Index measures international shipping rates of dry bulk cargo, mostly commodities used for industrial production. Higher demand for such goods, as manifested in higher shipping rates, indicates economic expansion. Last week the index rose 53 points, ending the week at 824 versus 771 the prior week.

12. 2-10 Spread – We track the 2-10 spread as an indicator of bank margin pressure. Last week the 2-10 spread widened by less than a basis point to 170 bps.

13. XLF Macro Quantitative Setup – Our Macro team’s quantitative setup in the XLF shows 1.1% upside to TRADE resistance and 0.8% downside to TRADE support.

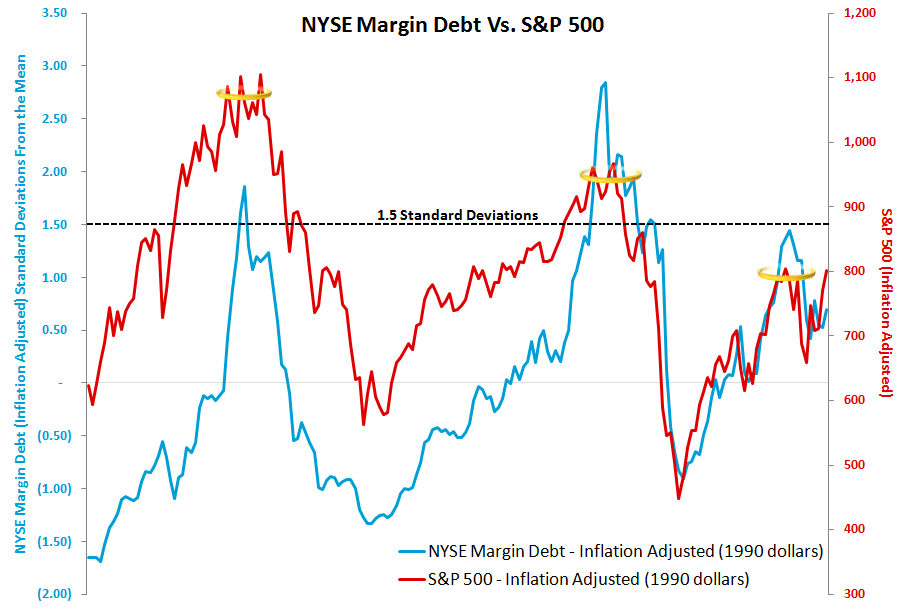
Margin Debt - January
We publish NYSE Margin Debt every month when it’s released. NYSE Margin debt hit its post-2007 peak in April of 2011 at $320.7 billion. The chart below shows the S&P 500 overlaid against NYSE margin debt going back to 1997. In this chart both the S&P 500 and margin debt have been inflation adjusted (back to 1990 dollar levels), and we’re showing margin debt levels in standard deviations relative to the mean covering the period 1. While this may sound complicated, the message is really quite simple. First, when margin debt gets to 1.5 standard deviations or greater, as it did last April, that has historically been a signal of extreme risk in the equity market - the last two times it did this the equity market lost half its value in the ensuing period. We flagged this for the first time back in May 2011. The second point is that margin debt trends tend to exhibit high degrees of autocorrelation. In other words, the last few months’ change in margin debt is the best predictor of the change we’ll see in the next few months. This is important because it means that margin debt, which retraced back to +0.55 standard deviations in November, still has a long way to go. We would need to see it approach -0.5 to -1.0 standard deviations before the trend runs its course. There’s plenty of room for short/intermediate term reversals within this broader secular move, as we saw in December and January's print of +0.53 and +0.70 standard deviations. Overall, however, this setup represents a long-term headwind for the market. One limitation of this series is that it is reported on a lag. The chart shows data through January.
Joshua Steiner, CFA
Allison Kaptur
Robert Belsky
Trouble viewing the charts in this email? Please click the link at the bottom of the note to view in your browser
