February gross gaming revenues (GGR) increased 23% YoY to $3.03BN. The timing of the Chinese New Year celebration in January of this year versus February of last year had a negative impact on YoY growth comparison which was offset by an easy hold comparison and an extra day this year. We estimate that total direct play this month accounted for 7.0% of the market, compared to 6.6% last year. The total VIP market held at 2.88% vs. 2.68% in February 2011. Accounting for direct play and theoretical hold of 2.85% in both months, February revenues would have increased 16% YoY. Without the benefit of the leap day, revenues would have been up about 13% YoY.
In a sign of slowing VIP growth, February was the first month since March 2009, that 4 of the 6 concessionaires saw declines in Junket RC volumes. On the bright side, Mass market table revenues continued to be strong, growing 31% YoY, and the 4th straight month of growth that led the market. Rolling Chip “only” increased 12% YoY. Obviously, the higher margin profile of the Mass business makes this trend a very palatable one for the operators. Commission rates do need to be monitored, however, given the slower growth of VIP coupled with the aggressive Four Seasons/Neptune deals.
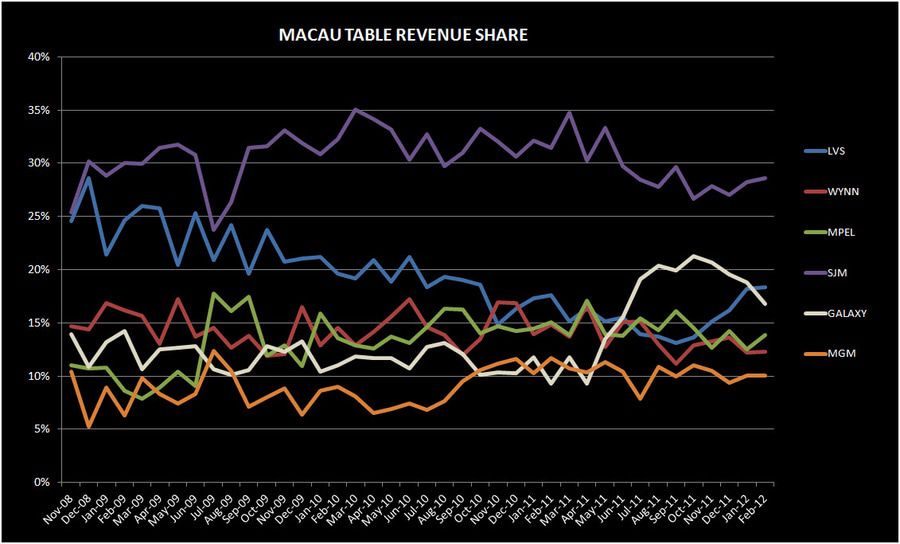
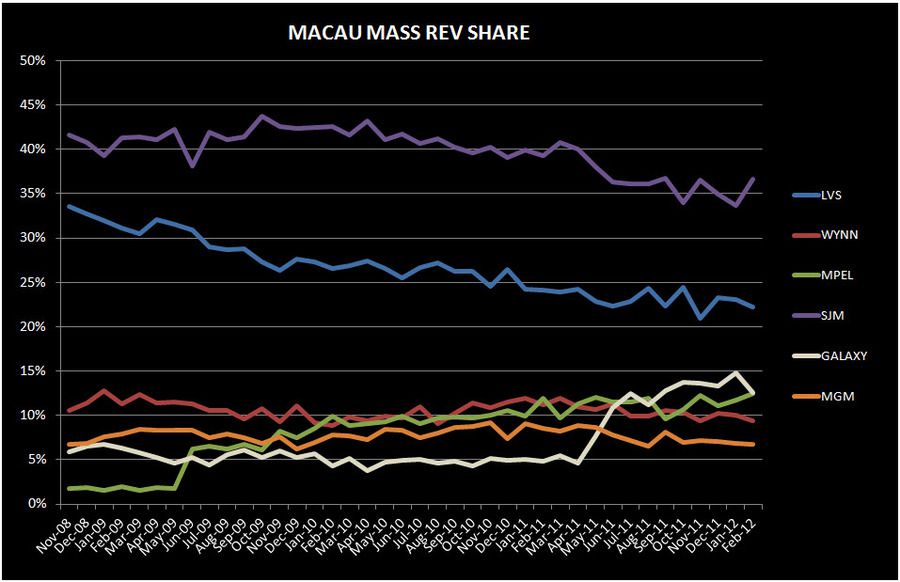
February market shares were very similar to January. After a slow start, MPEL was the biggest winner sequentially, driven by its highest Mass share ever at 12.5%, up 80bps MoM. Fundamentally, MPEL continues to knock the cover off the ball. If management would just come out and say they will not do a dilutive equity deal, this stock could have a real multiple.
Galaxy’s share fell sequentially following a strong, hold aided couple of months. Yes, VIP hold was low but Mass share fell
120bps MoM. Even on a normalized basis, Galaxy’s share is quite disappointing.
LVS posted another solid share month driven by higher hold and solid Rolling Chip growth. However, Mass share fell 80bps. LVS, WYNN, and Galaxy seem to be losing on the Mass side to SJM and MPEL.
Y-o-Y Table Revenue Observations
Total table revenue grew 23% YoY this month, on top of 47% growth last January. Given the extra day this year and the easy hold comparison from last year, the impact of the shift in the CNY holiday was likely neutral. Mass revenue growth of 31% was healthy but marked a deceleration from the +40% average growth we’ve seen since June 2011. VIP revenues grew 21%, while Junket RC “only” increased 12%, with both continuing the ‘slowing trend’ that we began to observe in October.
LVS
Table revenues grew 28% YoY, outpacing the market mostly due to strong hold across Sands and Four Seasons. We estimate that LVS’s properties held at 3.2% in February. At 32%, LVS had the best VIP growth after Galaxy and ranked #4 behind Galaxy, MPEL, and SJM for Mass table growth.
- Sands was only up 0.4% YoY despite high hold and an easy hold comparison
- Mass was up 1%
- VIP was up 0.1%. Sands held high in February. Assuming $300MM/month of direct play or 15% (in-line with the monthly absolute average in 4Q11), hold was 3.86% vs. 2.74% last February, assuming 10% direct play or $270MM/month (in-line with 4Q10).
- Junket RC was down 21%, the first double digit decline since September 09
- Venetian table revenues decreased 4% YoY, driven by a combination of a difficult hold comparison and low hold, and a drop in junket VIP RC volume
- Mass increased of 23%
- VIP decreased 18%, while junket VIP RC decreased 7%
- Assuming 27% direct play in the quarter (below the 28% we saw in 4Q11 but higher than 2011), hold was 2.67% compared to 3.24% in February 2011, assuming 19% direct play (in-line with 1Q11)
- Four Seasons grew 253% YoY, driven by a huge Junket RC growth, high hold, and an 87% increase in Mass revenues.
- Junket VIP RC increased 3.7x YoY
- Four Seasons is clearly seeing a benefit from LVS’s recent initiatives. If we assume that monthly direct play volume of ~$725MM from 687MM/month in 4Q11, that implies a direct play percentage of 15% and a hold rate of 3.43%. In comparison, if February 2011 direct play was around 50% (54% in 4Q10 and 40% in 1Q11) then hold was 2.46%.
WYNN
Wynn table revenues only increased 2.5%, exhibiting the lowest growth of all 6 concessionaires. While Wynn’s hold was low, last year’s comparison was also easy. Wynn’s average growth over the last 4 months has slowed to an average of 6%.
- Mass was up 10% and VIP increased 1%
- Junket RC fell 4%
- Assuming 11% of total VIP play was direct (in-line with 4Q11), we estimate that hold was 2.75% compared to 2.62% last year (assuming 10% direct play – in-line with 1Q11)
MPEL
MPEL grew 13%, propelled by strong Mass table growth at 37% behind Galaxy, offset by slower 8% growth in VIP
- Altira revenues fell 2%, due to a 3% decrease in VIP. Altira revenues have declined 3 of the last 4 months.
- Mass revenues increased 12%
- VIP RC decreased 10% - marking the 3rd consecutive month of declines
- We estimate that hold was 2.7%, compared to 2.5% in the prior year
- CoD table revenue was up 21%, driven by 41% growth in Mass and 15% growth in VIP
- Junket VIP RC fell 3%
- Assuming a 16% direct play level, hold was 3.2% in February compared to 2.8% last year (assuming 13.7% direct play levels in-line with 1Q11)
SJM
Revs grew 12%
- Mass was up 22% and VIP was up 8%
- Junket RC was down 7%, implying 2.89% hold across the company’s properties
GALAXY
For the 9th month in a row, Galaxy posted table revenues growth north of 100% - at 122%. Mass soared 239%, while VIP grew 105%.
- StarWorld table revenues grew 14%
- Mass grew 35% and VIP revenue grew 12%
- Junket RC grew 19%
- Hold was low at 2.3% but the comparison from last February was also easy, at 2.4%
- Galaxy Macau's total table revenues were $253MM – down MoM and 25% lower than October’s seasonal high and below November to January run rate of $281MM
- Mass table declined 23% MoM to $52MM, the lowest level since September 2011
- VIP table revenue declined 6% MoM to $201MM, also the lowest level since September
- Hold was 2.74% - the property’s lowest hold since opening
- RC volume of $7.3BN was 8% higher than January and compares to a peak of $8.3BN in October
MGM
Table revenues grew 6%, giving MGM the second slowest growth slot in February despite high hold
- Mass revenue growth was 4% - the slowest of the concessionaires for the 2nd month in a row
- VIP revenue grew 6%
- Junket RC declined 4%
- Assuming a direct play level of 9% for both periods, we estimate that hold was 3.12% this month vs. 2.83% in February 2011
Sequential Market Share
LVS
LVS share was flatish at 18.5% in February vs. 18.6% in January. This compares to a 6 month trailing market share of 15.5% and 2011 average share of 15.7%.
- Sands' share dropped 50bps to 4.2%. For comparison purposes, February share was below 2011's share of 4.6% and 6M trailing average share of 4.3%.
- VIP rev share decreased 50bps while Mass share fell 30 bps
- RC share decreased 30bps to just 2.4%, an all-time low for the property
- Venetian’s share dropped 1.8% to 7.9% from 9.7% in 4Q11- the lowest market share in 6 months. 2011 share was 8.4% and 6 month trailing share was 8.2%.
- VIP share decreased 1.9% to 5.9%
- Mass share fell 1.1% bps to 13.9%
- Junket RC fell 70bps to 4.8%
- January was the 5th consecutive month where FS gained share. FS share was 6.2%, up 2.4% and an all-time high. This compares to 2011 share of 2.2% and 6M trailing average share of 2.5%.
- VIP share increased 3.0% to 7.4%, an all-time property best –aided by high hold. This is the first time that FS VIP revenues exceeded those of Venetian and the second month in a row where they exceed Sands’ revenue.
- Mass share increased 50bps to 2.4%
- Junket RC improved 60bps to 5.9% - an all-time high for the property. January marked the second month where RC share at Four Seasons exceeded that of Sands Macao and the first where volumes exceeded Venetian's.
WYNN
Wynn’s share inched up 10bps to 12.6%, below its 6 month trailing average share of 12.9% and well below its 2011 average share of 14.1%. We expect Wynn’s share to continue to struggle with the opening of Sands Cotai Central in April.
- Mass market share fell 60bps to 9.4%
- VIP market share improved 30bps to 13.3%, despite below market hold
- Junket RC share fell to 13.3%, a 90bps MoM decline
MPEL
Flip-flopping once again, MPEL was the largest share winner in February. Market share bounced back 1.6% points to 14.1%. This compares to their 6 month trailing share of 14.2% and 2011 share of 14.8%.
- Altira share improved 30bps to 4.1%, still well below the property’s 2011 share of 5.3% and 6M trailing share of 4.6%
- Mass share ticked down 10bps to 1.4% while VIP share increased 30bps
- CoD’s share improved 1.1% to 9.8%; above its 2011 share of 9.3% and 6M trailing share of 9.5%
- Mass market share increased 80bps to 11%
- VIP share increased 80bps to 9.4%
- Junket RC was flat at 7.7%
SJM
SJM gained 60bps of share to 28.0%, better than their 6-month trailing average of 27.2% but below their 2011 average of 29.2%.
- Mass market share increased 3% off of January lows to 36.6%
- VIP share ticked down 30bps to 26.0%
- Junket RC share fell 1% to 27.8%
GALAXY
Galaxy was the biggest share loser in February, impacted by low hold. Galaxy’s share fell for the 5th consecutive month after ‘peaking’ at 20.9% in October. February share of 16.6% was 1.9%, down MoM and below the 6-month trailing average of 19.7%.
- Galaxy Macau share declined 70bps to 8.7% below its 6-month trailing average of 9.8%, partly due to low hold
- Mass share fell 1.5% to 7.2%, the lowest share in 6 months
- VIP decreased 50bps to 9.2%, the lowest share in 7 months
- RC share ticked increased 40bps to 10.4% - consistent with the 4 month average
- Starworld share fell 1.1% to 6.7% below its TTM average share of 9.1% before Galaxy Macau opened.
- Low hold was largely to blame for the share loss as Junket RC share increased 50bps to 10.8%
MGM
MGM share was flat at 10.3%. February share sits a little below MGM’s 2011 and 6-month trailing average share of 10.5%.
- Mass share ticked down 10 bps to 6.7%
- VIP share was flat at 11.2%
- Junket RC ticked up 10bps to 10.1%
Slot Revenue
Slot revenue totaled $132MM in February, with growth decelerating to just 9% YoY. None of the concessionaires hit records this month.
- As expected, GALAXY slot revenues grew the most with 251% YoY to $16MM
- MGM slot revenues had the second best growth at 16% YoY to $19MM
- MPEL slot revenues grew 9% YoY to $24MM
- SJM slot revenues grew 7% YoY to $17MM
- LVS slot revenues fell 10% YoY to $29MM- the company’s absolute lowest level since June 2011 and marking the 3rd YoY decline in 7 months
- Wynn experience the highest YoY decline with a 11% YoY drop to $25MM. This was Wynn’s first month of declines in 2 years.