When Confusion Reigns, Call in the Sine Wave
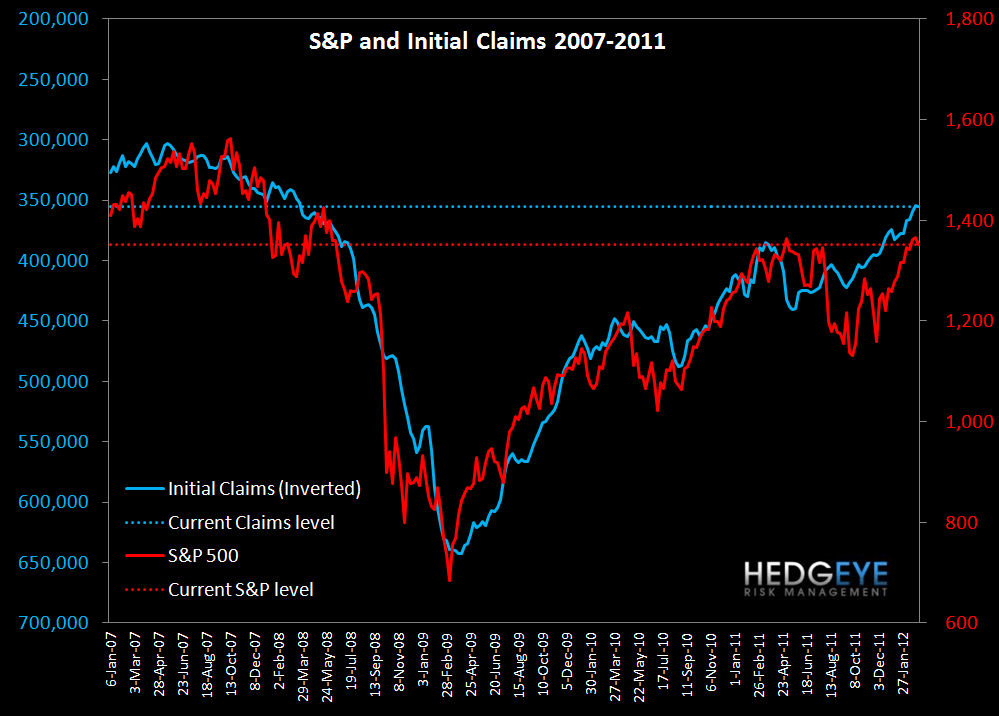
The headline initial claims number rose 11k WoW to 362k (up 8k after a 3k upward revision to last week’s data). Rolling claims rose 0.3k to 355k. On a non-seasonally-adjusted basis, reported claims rose 32k WoW to 366k.
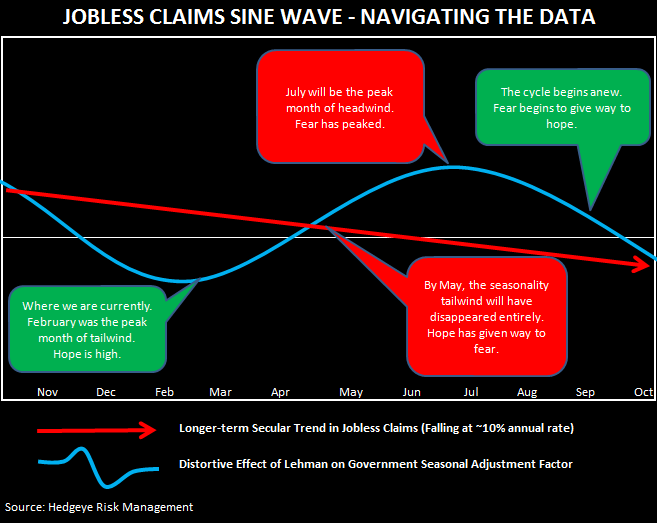
Today's print is consistent with our "Lehman's Ghost" thesis. To recap, the collapse of Lehman Brothers in late 2008 distorted the seasonal adjustment factors in various government data sets. The dislocation in the economic data was incorrectly read as a seasonal pattern and the factors were revised accordingly.
The seasonal distortion plays out as follows. Claims were understated in the last weeks of February by the largest amount. From now through May, the understatement disappears. Absent an underlying trend in the series, this effect will drive claims higher by 20-30k over the next three months. This trend continues to push claims higher by another 20k through July, by which time the series will be seeing its peak overstatement (claims are being reported higher than they actually are). Thereafter, the cycle starts over again. We do our best to depict this graphically with the sine wave chart below. The red arrow represents the current underlying trend in the jobs series, which is improving at a rate of around 3k per month. The blue sine wave represents the distortive impact the seasonal adjustment model is having on the data.


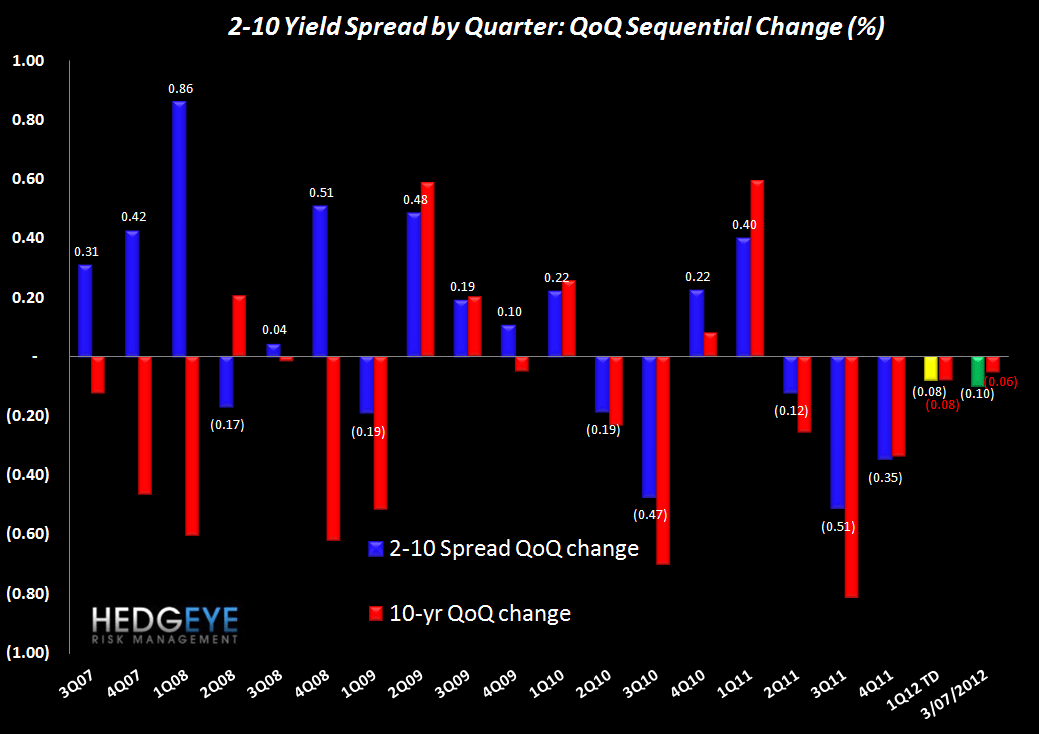
2-10 Spread
The 2-10 spread widened less than 1 bps versus last week to 168 bps as of yesterday. The ten-year bond yield also stayed relatively flat over last week, increasing less than 1 bps to 198 bps.

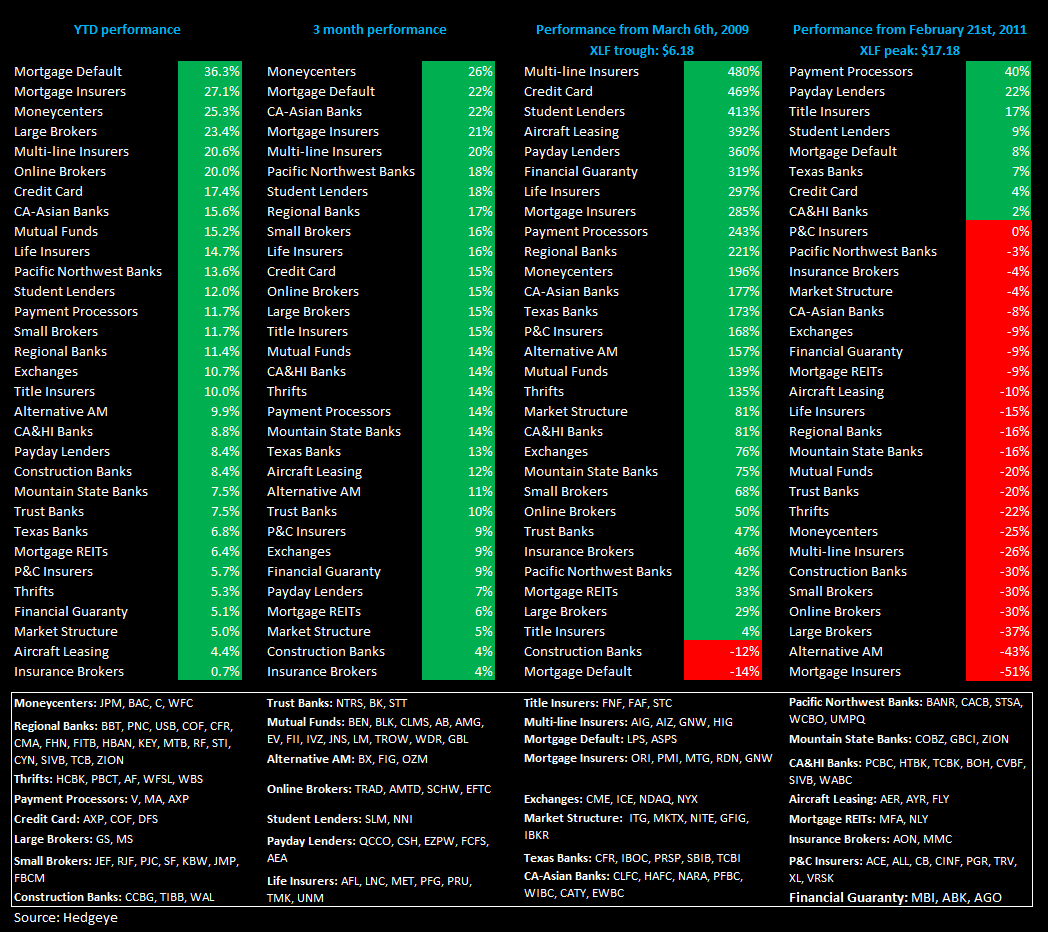
Financial Subsector Performance
The table below shows the stock performance of each Financial subsector over four durations.
Joshua Steiner, CFA
Allison Kaptur
Robert Belsky
Having trouble viewing the charts in this email? Please click the link at the bottom of the note to view in your browser.