The Ghost of Lehman
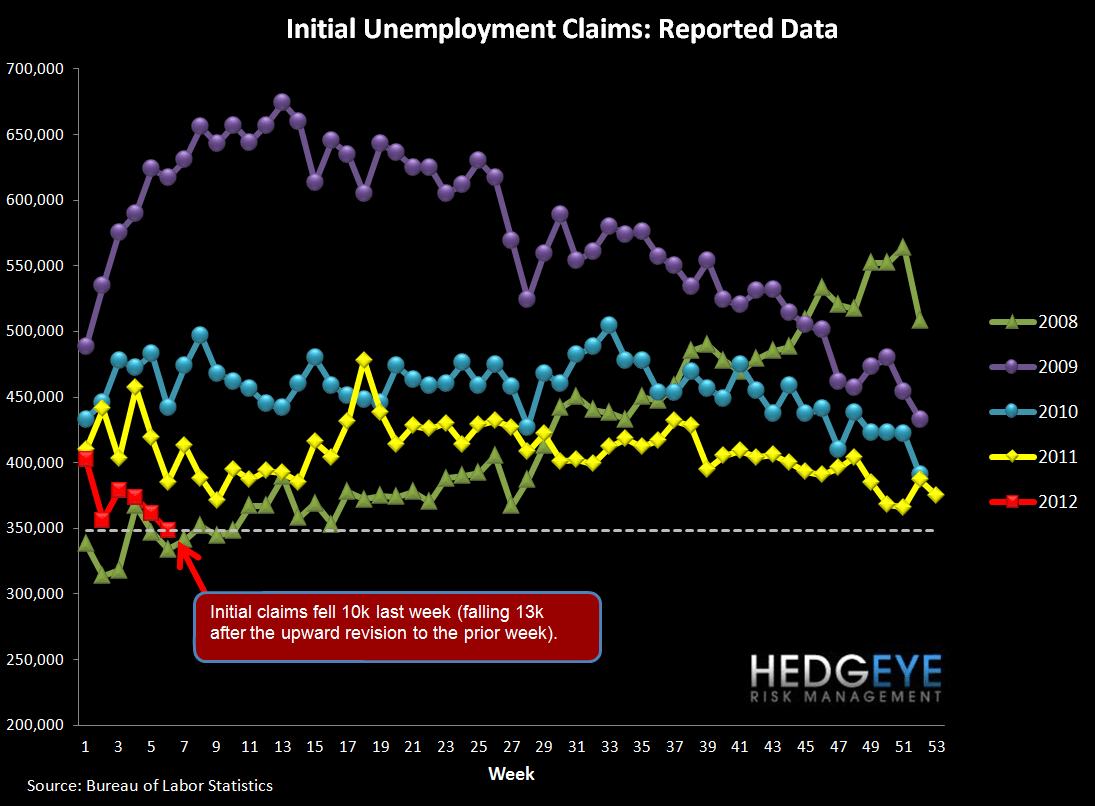
The ghost of Lehman Brothers continues to provide a data tailwind on this series, but that tailwind should turn headwind within a couple of weeks. For reference, after Lehman collapsed in September, 2008, the parabolic increase in jobless claims rippled through the government's seasonal adjustment factors, which mistook fundamentals for seasonality. Consequently, future years (2010 and 2011) have seen the ghost of the Brothers Lehman manifest in all sorts of government data reported on a seasonally adjusted basis. You can observe this plainly by eyeballing the late 2008 and early 2009 data in the chart below and then looking at the same time periods over the next two years.
We think it's no coincidence that the market's behavior has rolled from positive to negative in the March/April timeframe in each of the last two years. While we think there's still considerable room to run on our bullish thesis, we're cognizant that this tailwind will turn headwind in the intermediate term.
The Data
The headline initial claims number fell 10k WoW to 348k (down 13k after a 3k upward revision to last week’s data). Rolling claims fell 1.75k to 365k. On a non-seasonally-adjusted basis, reported claims fell 39k WoW to 362k. We continue to think that claims below 375-400k have the ability to lower the unemployment rate, which promotes a virtuous cycle as confidence and sentiment respond.


2-10 Spread
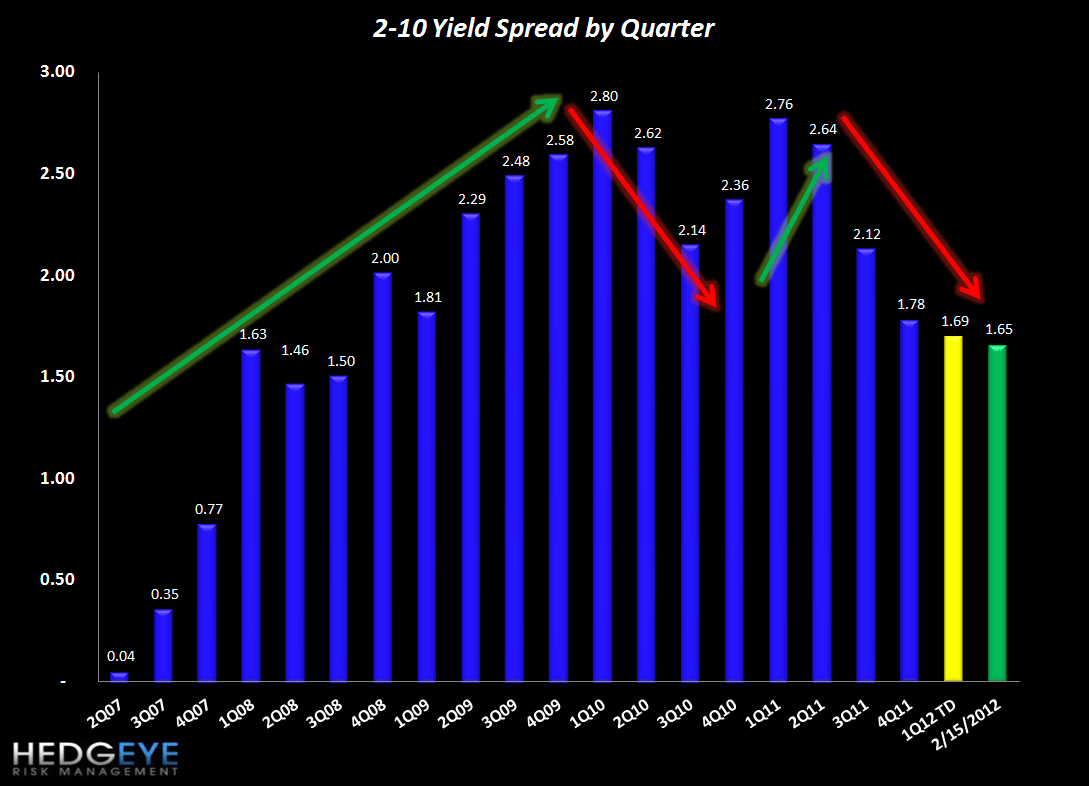
The 2-10 spread tightened 7 bps versus last week to 165 bps as of yesterday. The ten-year bond yield decreased 6 bps to 193 bps.

Financial Subsector Performance
The table below shows the stock performance of each Financial subsector over four durations.

Joshua Steiner, CFA
Allison Kaptur
Robert Belsky
Having trouble viewing the charts in this email? Please click the link below to view in your browser.
