Mass leads the way. LVS was the clear winner as junket investment begins to pay off.
January gross gaming revenues (GGR) increased 35% YoY to $3.13BN. The timing of Chinese New Year celebration in January of this year versus February of last year clearly had a positive impact. We estimate that total direct play this month accounted for 7.0% of the market, compared to 6.0% last year. The total VIP market held at 3.01% vs. 3.08% in January 2011. Accounting for direct play and theoretical hold of 2.85% in both months, December revenues would have increased 37% YoY. Higher margin mass and slot revenues grew faster than VIP volumes this month. We expect to see this trend continue in 2012.
As we wrote earlier this morning in “FEBRUARY IN MACAU,” February faces the challenge of comping against CNY last year which will be somewhat offset by an extra day and an easy hold comparison, estimated at 2.65%.
Some interested trends to note from January include:
- LVS’s investment in Four Seasons continued to pay dividends:
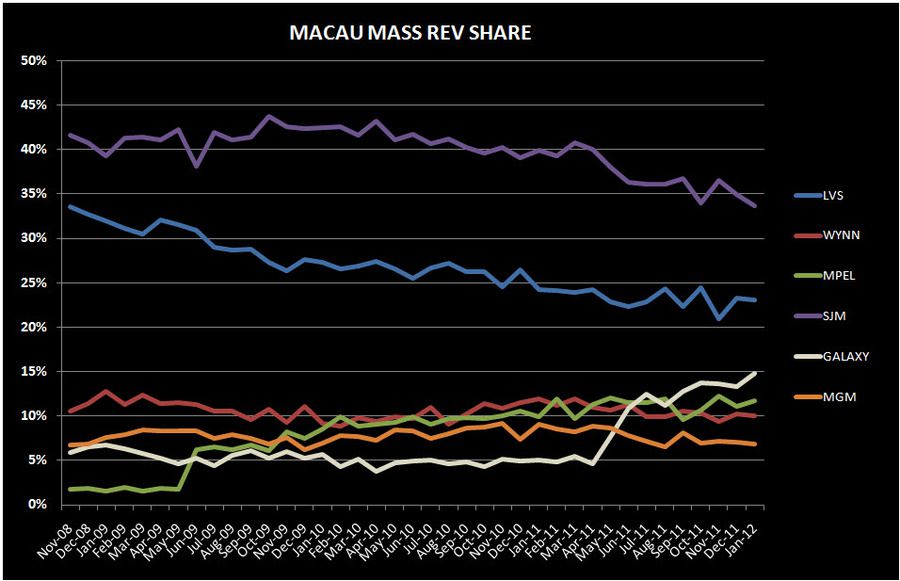
- LVS’s gained market share for the 4th month in a row - reaching 18.6% in January
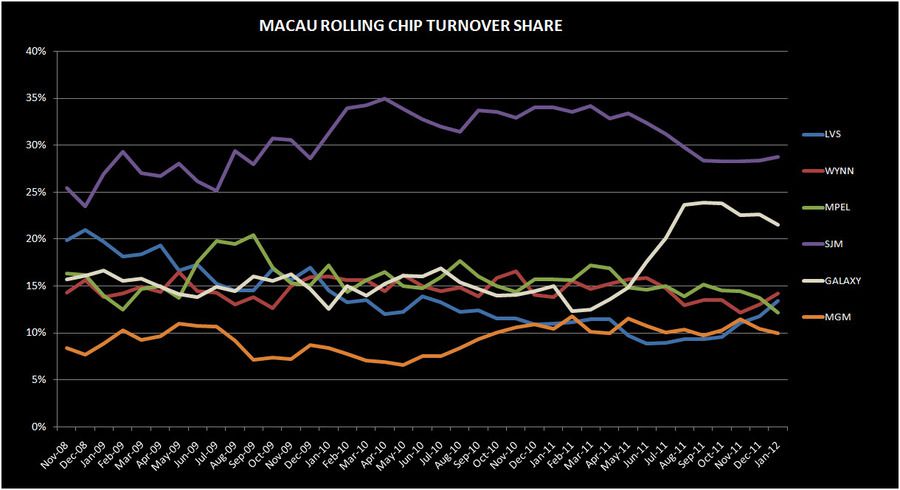
- FS rolling chip (RC) market share hit a record of 5.3%, surpassing Sands Macau for the second month in a row and coming within 10bps of Venetian’s market share
- Despite being the biggest share loser, MPEL’s growth in Mass was impressive and bested only by Galaxy
- MPEL mass revenues grew 74%, with 86% YoY growth at CoD
- Galaxy lost market share for the 4th straight month
- Record market shares north of 20% in past months were clearly assisted by high hold at Galaxy Macau which has averaged 3.24% since opening
- LVS, MPEL and Galaxy experienced record slot revenues
Y-o-Y Table Revenue Observations
Total table revenue grew 35% YoY this month, on top of 33% growth last January, helped by the shift in the CNY holiday. The shift in the holiday makes YoY comparisons for January and February somewhat less comparable. Mass revenue growth of 46% was in-line with the accelerated growth we saw last month. VIP revenues grew 31% and Junket RC rose 33%, with both continuing the ‘slowing trend’ that we began to observe in October.
LVS
Table revenues grew 41% YoY, showing a continuation of the pickup from the opening of junket rooms at Four Seasons and the best absolute month of growth since July 2010. At 43%, LVS had the best VIP growth after Galaxy and ranked #3 behind Galaxy and MPEL for Mass table growth.
- Sands was up 7% YoY despite high hold
- Mass was up 19%
- VIP was up 1%. Sands held high in January. Assuming 12% direct play (in-line with 4Q11), hold was 4.24% vs. 3.37% last January, assuming 10% direct play (in-line with 4Q10).
- Junket RC was down 21%, the first double digit decline since September 09
- Venetian was up 64% YoY, driven by a combination of easy hold comparisons, a pick up in VIP RC growth, and strong Mass growth
- Mass increased of 49%, posting the highest YoY growth at the property
- Junket VIP RC increased 34%
- Assuming 25% direct play in the quarter (below the 28% we saw in 4Q11 but higher than 2011), hold was 3.33% compared to 2.64% hold in January 2011, assuming 19% direct play (in-line with 1Q11)
- Four Seasons grew 50% YoY, driven by a huge Junket RC growth but dampened by a very difficult hold comparison and low hold and to a much lesser extent, 39% increase in Mass revenues.
- Junket VIP RC increased 5.6x YoY
- Four Seasons is clearly seeing a benefit from LVS’s recent initiatives. If we assume that monthly direct play volume picked up to ~800MM from 687MM/month in 4Q11, that implies a direct play percentage of 18.5% and a hold rate of 2.26%. In comparison, if January 2011 direct play was around 45% (54% in 4Q10 and 40% in 1Q11) then hold was 6.3%.
WYNN
Wynn table revenues were up 18.4%, negatively impacted by low hold
- Mass was up 22% and VIP increased 17%
- Junket RC increased 36%
- Assuming 11% of total VIP play was direct (in-line with 4Q11), we estimate that hold was 2.65% compared to 3.07% last year (assuming 10% direct play – in-line with 1Q11)
MPEL
MPEL had the slowest growing table revenues of the 6 concessionaires in January; however, its Mass table growth was the best of all the concessionaires excluding Galaxy. Table revenues grew 16% - driven primarily by 74% growth in Mass and 5% growth in VIP.
- Altira revenues plunged 24%, due to a 27% decrease in VIP
- Mass revenues increased 19%
- VIP RC decreased 26% - marking the second month of declines
- We estimate that hold was 3.3%, similar to the prior year
- CoD table revenue was up 51%, driven by 86% growth in Mass and 39% growth in VIP
- Junket VIP RC grew 32%
- Assuming a 15.5% direct play level, hold was 2.9% in January compared to 2.8% last year (assuming 13.7% direct play levels in-line with 1Q11)
SJM
Revs grew 18%
- Mass was up 23% and VIP was up 16%
- Junket RC was up 12%, implying 2.96% hold across the company’s properties
GALAXY
For the 8th month in a row, Galaxy posted table revenues growth north of 100% - at 115%. Mass soared 333%, while VIP grew 90%.
- StarWorld table revenues grew 4%
- Mass grew 78% while VIP declined 1.4%, negatively impacted by a difficult hold comparison
- Junket RC grew 13%
- Hold was 2.9% compared to hold of 3.3% hold last January
- Galaxy Macau's total table revenues were $281MM – flat MoM and 17% lower than October’s seasonal high and $1MM below November
- Mass table increased 12% MoM to $68MM, setting a property high
- VIP table revenue declined MoM to $213MM
- Hold was 3.15% - ‘high’ but lower than the last few months
- RC volume of $6.8BN was 1% higher than December and compares to a peak of $8.3BN in October
MGM
Table revenues grew 32%
- Mass revenue growth was 10% - the slowest of the concessionaires
- VIP revenue grew 38%
- Junket RC increased 27%
- Assuming a direct play level of 8% for both periods, we estimate that hold was 3.35% this month vs. 3.09% in January 2011
Sequential Market Share
LVS
LVS was the biggest winner in January, gaining 2% to 18.6% - the company’s best since October 2010. This compares to a 6 month trailing market share of 14.8% and 2011 average share of 15.7%.
- Sands' share dropped 20bps to 4.7%. For comparison purposes, January share improved over 2011's share of 4.6% and 6M trailing average share of 4.1%.
- VIP rev share decreased 20bps while Mass share fell 10 bps
- RC share decreased 30bps to just 2.7%, an all-time low for the property
- Venetian’s share increased to 9.7% from 8.1% in 4Q11 and the highest market share since Feb 2011. 2011 share was 8.4% and 6 month trailing share was 7.8%.
- VIP share increased 2.2% to 7.8%
- Mass share edged down 10bps to 15.0%
- Junket RC increased 50bps to 5.4%
- January was the 4th month in a row where FS gained share. FS share was 3.8%, up 60bps. This compares to 2011 share of 2.2% and 6M trailing average share of 2.3%.
- VIP share increased 10bps to 3.5%, the best share since January 2011
- Mass share fell 20bps to 1.9%
- Junket RC improved 1.4% to 5.3% - an all-time high for the property. January marked the second month where RC share at Four Seasons exceeded that of Sands Macao. It came within 10bps of Venetian’s share.
WYNN
Low hold contributed to Wynn’s share decrease of 1.3% to 12.5%, below its 6 month trailing average share of 13.3% and well below its 2011 average share of 14.1%. We expect Wynn’s share to continue to struggle with the opening of Sands Cotai Central in March.
- Mass market share ticked down 20bps to 10.0%
- VIP market share decreased 1.9% to 13.0% as a result of low hold
- Junket RC share increased 1.4% to 14.2%
MPEL
In a reversal from December, MPEL was the biggest share loser in January (this seems to be a pattern for them – going from best to worst and back again). Market share plunged 1.6% points to 12.8% - the company’s worst share since December 2009. This compares to their 6 month trailing share of 14.7% and 2011 share of 14.8%.
- Altira share fell 50bps to 3.8%, below the property’s 2011 share of 5.3%
- Mass share was flat at 1.5% while VIP share fell 80bps
- CoD’s share fell 90bps to 8.7%; below its 2011 share of 9.3%
- Mass market share increased 60bps to 10.2%
- VIP share dropped 1.8% to 8.2%
- Junket RC fell 1.0% to 7.7%
SJM
SJM gained 70bps of share to 27.4%, which is basically in-line with their 6-month trailing average of 27.3% but below their 2011 average of 29.2%.
- Mass market share decreased 1.3% to 33.6% - an all-time company low
- VIP share increased 2.2% to 26.3%
- Junket RC share increased 40bps to 28.8%
GALAXY
Galaxy lost market share for the 4th month in a row after ‘peaking’ at 20.9% in October. January share of 18.5% was 70bps down MoM and below the 6-month trailing average of 19.8%.
- Galaxy Macau share declined 60bps to 9.4% below its 6-month trailing average of 9.6%
- Mass share increased 70bps to 8.7% while VIP decreased 1.0% to 9.7%
- RC share ticked fell 40bps to 9.9%
- Starworld share ticked up 10bps to 7.8% but was 1.3% below its TTM average share of 9.1% before Galaxy Macau opened.
MGM
MGM gained 50bps to 10.2% due to share gains in VIP share offset by losses in Mass market share. January share sits between MGM’s 2011 share of 10.5% and their 6-month trailing average of 10.1%.
- Mass share was down 30bps to 6.8%
- VIP share improved 90bps to 11.2%
- Junket RC fell 40bps to 10.0%
Slot Revenue
Slot revenue growth accelerated to 42% YoY, hitting an all-time record of $145MM and improving $10MM sequentially. Half the concessionaires experienced all-time high slot revenues this month.
- As expected, GALAXY slot revenues grew the most with 754% YoY to $17MM – an all-time record for the company
- LVS slot revenues had the second best growth at 43% YoY to $40MM – a record for the company
- MPEL slot revenues grew 37% YoY to $27MM – marking a new company record high
- Wynn slot revenues grew 23% YoY to $27MM
- MGM slot revenues grew 18% YoY to $20MM, down $2MM from its record month of December
- SJM had the slowest slot revenue growth at just 5% YoY to $15MM