VIP hold was normal but lower than last year which held back growth by 5%.
December gross gaming revenues (GGR) increased 25% YoY to $2.95BN. As we discussed in our November detail note, December faced a tough hold comparison which negatively impacted growth this month. Total direct play this month was 6.5% of the market, compared to 7.1% last year. The total market held at 2.97% vs. 3.13% in December of 2010. Accounting for direct play and theoretical hold of 2.85% in both months, December revenues would have increased 30% YoY or 5% better than actual. More important than the overall deceleration of growth in December which everyone expected, was the acceleration in high margin Mass business which increased 47%, above the 40% growth we’ve seen during the last 6 months.
Macau faces a slightly difficult hold comparison in January although we expect YoY growth to accelerate nicely from December due to the timing of Chinese New Year. We are projecting 32-40% growth for January.
Other observations from December include:
- LVS and MPEL generated the highest same store revenue growth in December – both up 24%
- MPEL’s growth was generated by a whopping 54% increase in Mass revenue which should be good for margins
- Despite its focus on VIP, LVS still grew Mass 29% but lower hold kept VIP revenue growth at 20% with VIP volume growth at 35%
- All of LVS’s VIP revenue growth was concentrated at Four Seasons (new junket rooms) while VIP revenues fell at both Venetian and Sands
- Wynn’s Mass growth was solid at 30% but trailed the market. VIP revenues actually declined 5% YoY despite a 16% increase in VIP volume.
- VIP revenue also fell YoY for MGM despite higher volumes
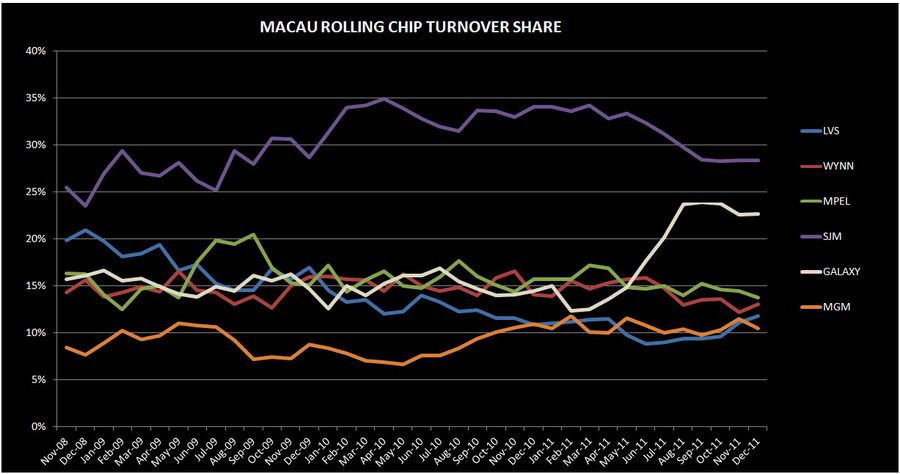
- In terms of market share gainers, MPEL and LVS were the big winners while Wynn also improved from November. Galaxy, MGM, and SJM all lost share sequentially.
Y-o-Y Table Revenue Observations
Total table revenue growth slowed to 25% YoY this month, on top of 68% growth last December. December Mass revenue growth accelerated to 47% - the best YoY growth print since we’ve been tracking the data. VIP revenues grew 18% while Junket RC rose 25% - with both posting the slowest growth rate since August 2009.
LVS
Table revenues grew 24% YoY, showing a continuation of the pickup from the opening of junket rooms at Four Seasons.
- Sands was up only 2% YoY despite high hold
- Mass as up 11%
- VIP was down 2%, off of a tough comp of 63%. Assuming 15% direct play (in-line with 3Q11), hold was 3.9% vs. 3.7% last December assuming the same level of direct play (also in-line with 4Q10)
- Junket RC was down 9%
- Venetian was up 11% YoY, driven by a Mass increase of 35% and somewhat offset by a 5% decline in VIP
- Junket VIP RC increased 8%
- Assuming 23% direct play in the quarter (just below the 24% we saw in 3Q11), hold was 2.6% compared to 3.0% hold in December 2010 assuming 19% direct play (in-line with 4Q10)
- Four Seasons grew 216% YoY, driven by a tripling (309%) of YoY VIP revenue and to a much lesser extent, 54% increase in Mass revenues.
- Junket VIP RC increased 3.4x YoY
- Four Seasons is clearly seeing a benefit from LVS’s recent initiatives plus an easy YoY hold comparison. If we assume that monthly direct play volume was in the neighborhood of recent trends - ~600MM, that implies a direct play percentage of 19% and a hold rate of 2.33%. In comparison, if December 2010 direct play was in-line with the rest of 4Q10 at 54%, then hold was just 1.25%.
WYNN
Wynn table revenues were up just 0.3%, exhibiting the slowest growth of the 6 concessionaires, despite high hold (although hold comparisons were even higher to be fair). December’s growth was also Wynn’s slowest growth month since August 2009. As we’ve written about in “Macau Observations” on 11/16, Wynn is in a bit of pickle given LVS’s recent initiatives, the general continued shifts of play to Cotai, and the general constraints at the property.
- Mass was up 30% and VIP declined 5% (December was actually the 4th month in 2011 where VIP growth was negative)
- Junket RC increased 16%
- Assuming 10% of total VIP play was direct (in-line with 3Q11), we estimate that hold was 3.3% compared to 4.0% last year (assuming 11% direct play – in-line with 4Q10)
MPEL
Table revenues grew 24% - driven primarily by 54% growth in Mass and 19% growth in VIP
- Altira revenues increased 10%, due to a 9% increase in VIP and a 20% lift in Mass growth. VIP revenues benefited from high hold and easy comparisons.
- VIP RC decreased 18%
- We estimate that hold was 3.3% vs. 2.6% last year (direct play is not material at Altira)
- CoD table revenue was up 32%, driven by 61% growth in Mass and 24% growth in VIP
- Junket VIP RC grew 36%
- Assuming a 15.5% direct play level, hold was 3.1% in December compared to 3.2% last year
SJM
Revs grew 10%
- Mass was up 31% and VIP was up just 1%
- Junket RC was up 4%
GALAXY
Table revenues continued its 7-month streak of triple-digit gains, +137%; Mass soared 299%, while VIP gained 117%
- StarWorld table revenues grew 5%
- Mass grew 66% and VIP grew just 0.6%, negatively impacted by a difficult hold comparison
- Junket RC grew 10%
- Hold was 2.8% compared to normal hold of 3.1% hold last December
- Galaxy Macau's total table revenues were $281MM, 17% lower than October’s seasonal high and $1MM below November
- Mass table of $61MM, up 8% sequentially and $2MM above October's high
- VIP table revenue of $220MM, a 2% MoM decrease, despite high hold of 3.3% - although hold was even higher in November at 3.5%.
- RC volume of $6.7BN compared to $8.3BN in October, $6.5BN in November and $7.0BN in September
MGM
Table revenues only increased 0.5% YoY, impacted by a difficult hold comparison
- Mass revenue growth was 39%, while VIP fell 6%
- Junket RC increased 19%
- Assuming a direct play level of 8%, we estimate that hold was 2.9% this month vs. 3.7% in December 2010, assuming direct play of 8%
Sequential Market Share
LVS
LVS gained 90bps in December to 16.6%. This compares to 6 month trailing market share of 14.7% and 2011 average share of 15.7%.
- Sands' share increased 90bps to 4.9%
- VIP rev share increased 1.3% while Mass share fell 70 bps
- RC share decreased 50bps
- Venetian’s share remained flat at 8.1% share for the 3rd month in a row
- VIP share declined 120 bps to 5.6%, compared to the 2011 average of 6.6%
- Mass share improved 2.6% sequentially to 15.1%, recovering most of the 3% share loss last month
- Junket RC ticked up 20bps to 4.9%
- FS share improved 10bps to 3.1%
- VIP share increased 10bps to 3.5% the best share since January 2011
- Mass share increased 40bps to 2.1%
- Junket RC improved 90bps to 3.9% - an all-time high for the property (in-line with Dec 2009)
WYNN
Wynn’s share ticked up 40bps to 13.8% above its 6 month trailing average share of 13.6% but well below its 2011 average share of 14.1%. Wynn’s share should continue to struggle with the opening of Sands Cotai Central in March.
- Mass market share recovered 90bps to 10.2%
- VIP market share increased 40bps to 14.9%
- Junket RC share increased 90bps to 13% - below Wynn’s 6 month trailing average of 13.8% and 2011 average of 14.2%
MPEL
MPEL was the largest share gainer in December (following a month of being the biggest loser). Market share improved 1.5% points to 14.4%. This compares to their 6 month trailing share of 14.6% and 2011 share of 14.8%.
- Altira share ticked up 10bps to 4.3%, but was still below the property’s 2011 share of 5.3%. Mass share fell 40bps while VIP share improved 40bps.
- CoD’s share improved 1.5% to 9.9% driven by share gains in VIP that were partly offset by share loss in Mass
- Mass market share decreased 70bps to 9.6%
- VIP share recovered its share losses in November, improving 2.2% to 10.0%
- Junket RC improved 40bps to 8.7%
SJM
SJM lost 0.8% share in December to 26.4%, which is below their 6-month trailing average of 27.7% and below their 2011 average of 29.2%.
- Mass market share decreased 1.6% to 35.9%
- VIP share decreased 90bps to 24.1% - the lowest share for SJM since August 2009
- Junket RC share was flat at 28.4%
GALAXY
Galaxy lost the most share in December, dropping 1.1% to 19.1%. December share compares with an average share of 15.7% in 2011 and a 6 month trailing average of 19.1%.
- Galaxy Macau share declined 20bps to 10.0%
- Mass share declined 30bps to 8.0%
- VIP market share ticked down 10bps to 10.7%
- RC share ticked down 10bps to 10.3%
- Starworld lost 1.1% share to 7.7%, 1.4% below its TTM share of 9.1% pre-Galaxy Macau level.
MGM
MGM lost 90bps to 9.7% due to share losses in VIP share. December share compares with an average share of 10.5% in 2011 and a 6 month trailing average of 10.3%.
- Mass share was flat at 7.1%
- VIP share fell 1.3% to 10.3%
- Junket RC fell 1.0% share to 10.4% – in-line with MGM’s 6 month trailing average
Slot Revenue
Slot revenue growth accelerated to 37% YoY, hitting an all-time record of $135MM and improving $20MM sequentially.
- As expected, GALAXY slot revenues grew the most with 393% YoY to $15MM
- MGM slot revenues had the second best growth at 54% YoY to $22MM – a record for the property
- LVS slot revenues grew 30% YoY to $33MM –flat with the last 2 months
- SJM slot revenues grew 22% YoY to record $19MM
- MPEL slot revenues grew 20% YoY to $24MM
- WYNN slot revenues grew the slowest at 10% YoY to $23MM