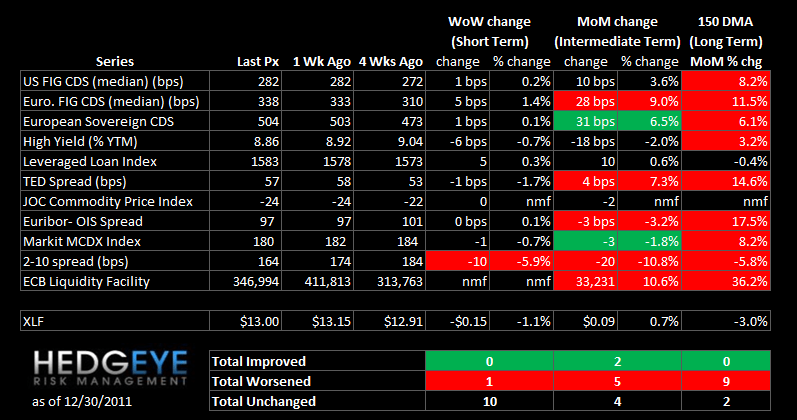
Highlights from this week's Risk Monitor
* The TED spread declined by one basis point (57.1 bps) vs. last week's value of 58.1 bps. We're hesitant to read much into this as it is essentially unchanged and reflected a quiet week. Euribor/OIS showed similar trends with that metric coming in at 97.4 bps this week vs. 97.3 bps last week. For reference, intra-week the measure peaked at 98.8 bps. These are important gauges of perceived risk among interbank participants. We continue to monitor these two measures closely for signs of improvement or further deterioration in participant confidence.
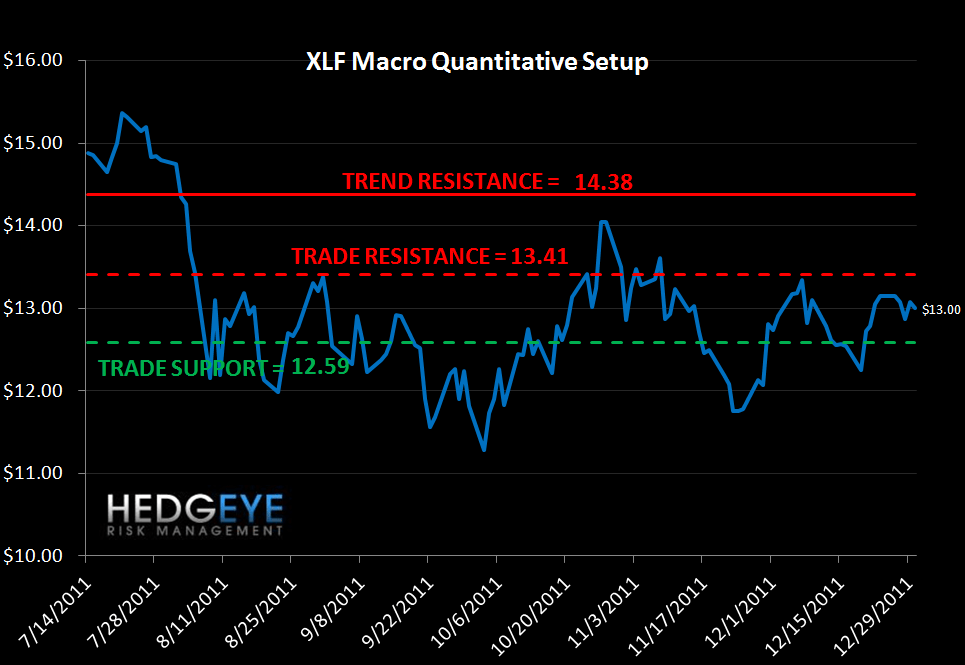
* Even Steven - Our macro quantitative model indicates that on a short term duration (TRADE), there is equal upside and downside in the XLF (3.2% downside vs. 3.2% upside).
Financial Risk Monitor Summary (Across 3 Durations):
- Short-term (WoW): Neutral / 1 of 11 improved / 1 out of 11 worsened / 9 of 11 unchanged
- Intermediate-term (MoM): Negative / 2 of 11 improved / 5 of 11 worsened / 4 of 11 unchanged
- Long-term (150 DMA): Negative / 1 of 11 improved / 9 of 11 worsened / 1 of 11 unchanged
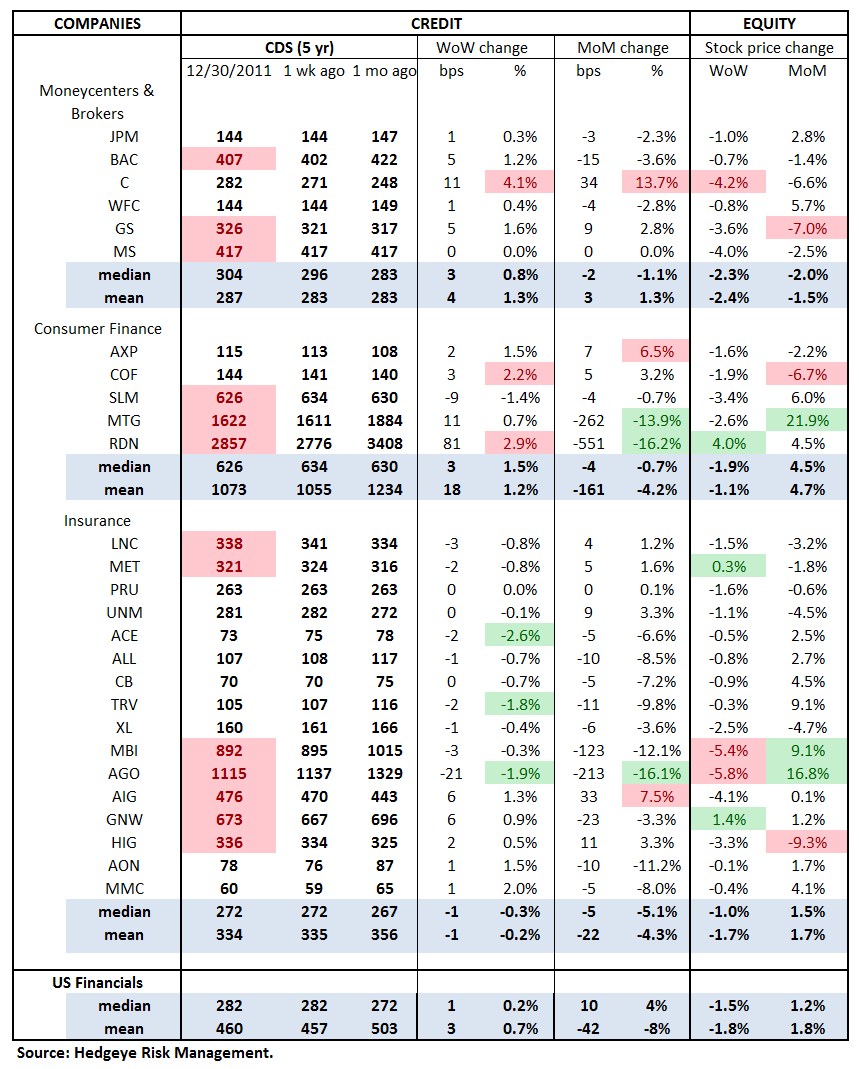
1. US Financials CDS Monitor – Swaps widened for 14 of 27 major domestic financial company reference entities last week.
Widened the most vs last week: C, COF, RDN
Tightened the most vs last week: ACE, TRV, AGO
Widened the most vs last month: C, AXP, AIG
Tightened the most vs last month: MTG, RDN, AGO
2. European Financials CDS Monitor – Bank swaps were wider in Europe last week for 30 of the 40 reference entities. The average widening was 0.4% and the median widening was 1.4%

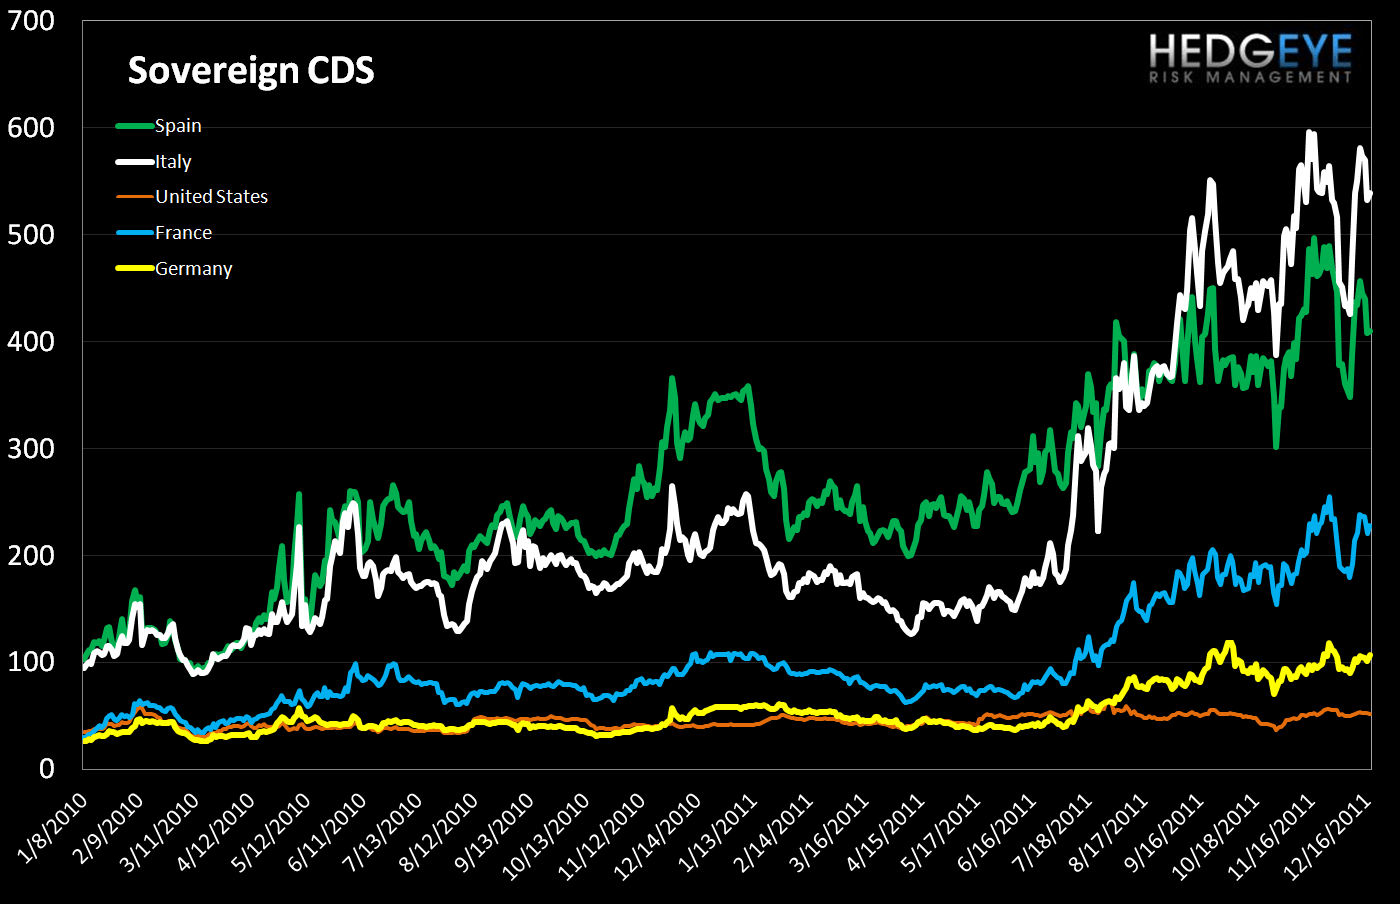
3. European Sovereign CDS – European sovereign swaps remained relatively flat over last week. Irish sovereign swaps widened by 1.3% (+10 bps to 726) and Spanish tightened by 3.1% (-12 bps to 410).

4. High Yield (YTM) Monitor – High Yield rates fell 6 bps last week, ending the week at 8.86 versus 8.92 the prior week.

5. Leveraged Loan Index Monitor – The Leveraged Loan Index rose 5 points last week, ending at 1583.

6. TED Spread Monitor – The TED spread fell 1 basis point last week, ending the week at 57.1 this week versus last week’s print of 58.1.

7. Journal of Commerce Commodity Price Index – The JOC index fell less than a point, ending the week at -23.9 versus -23.6 the prior week.

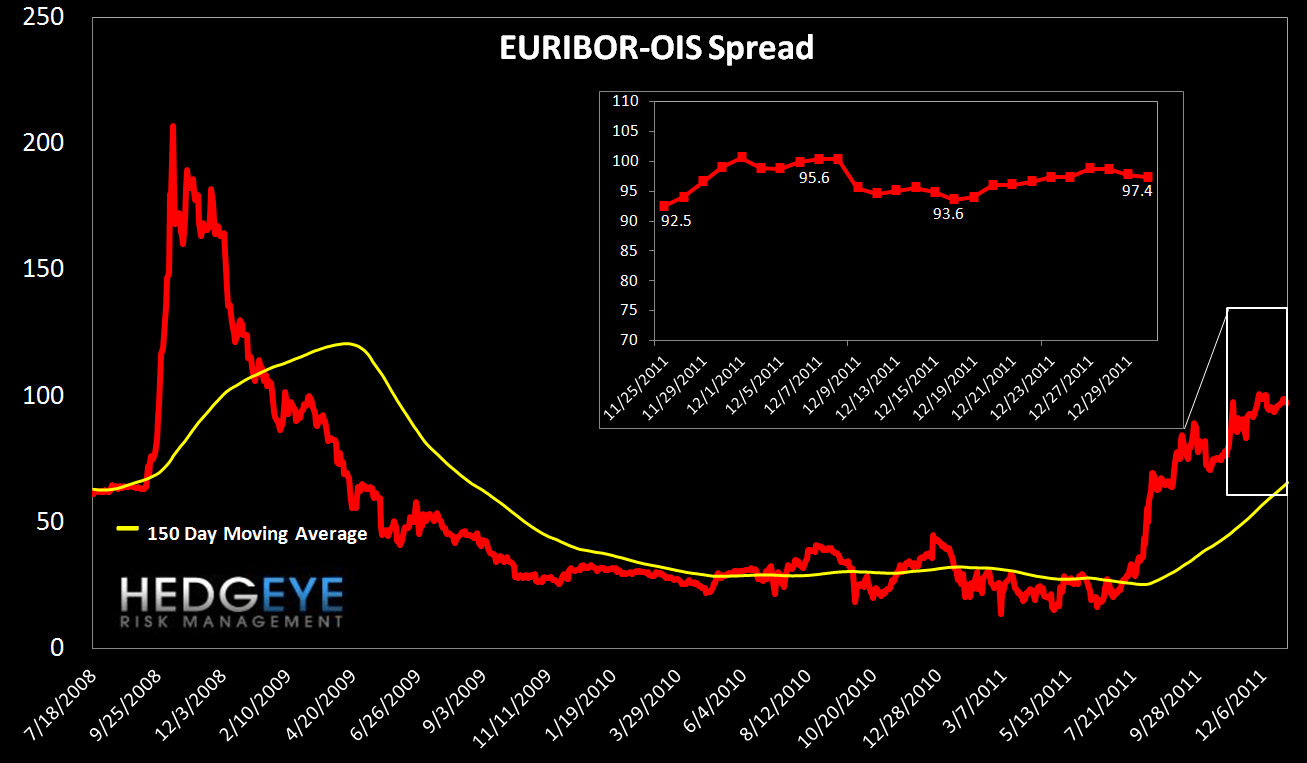
8. Euribor-OIS spread – The Euribor-OIS spread (the difference between the euro interbank lending rate and overnight indexed swaps) measures bank counterparty risk in the Eurozone. The OIS is analogous to the effective Fed Funds rate in the United States. Banks lending at the OIS do not swap principal, so counterparty risk in the OIS is minimal. By contrast, the Euribor rate is the rate offered for unsecured interbank lending. Thus, the spread between the two isolates counterparty risk. The Euribor-OIS spread widened by less than 1 bp to 97 bps.
9. ECB Liquidity Recourse to the Deposit Facility – The ECB Liquidity Recourse to the Deposit Facility measures banks’ overnight deposits with the ECB. The ECB pays lower rates than the market, so an increase in this metric demonstrates increased perceived counterparty risk and liquidity hoarding. The Liquidity Recourse hit a new all time high on Tuesday but has since fallen.

10. Markit MCDX Index Monitor – The Markit MCDX is a measure of municipal credit default swaps. We believe this index is a useful indicator of pressure in state and local governments. Markit publishes index values daily on six 5-year tenor baskets including 50 reference entities each. Each basket includes a diversified pool of revenue and GO bonds from a broad array of states. We track the 14-V1. Last week spreads tightened, ending the week at 180 bps versus 182 bps the prior week.

11. Baltic Dry Index – Data on The Baltic Dry Index was not available at time of publication.
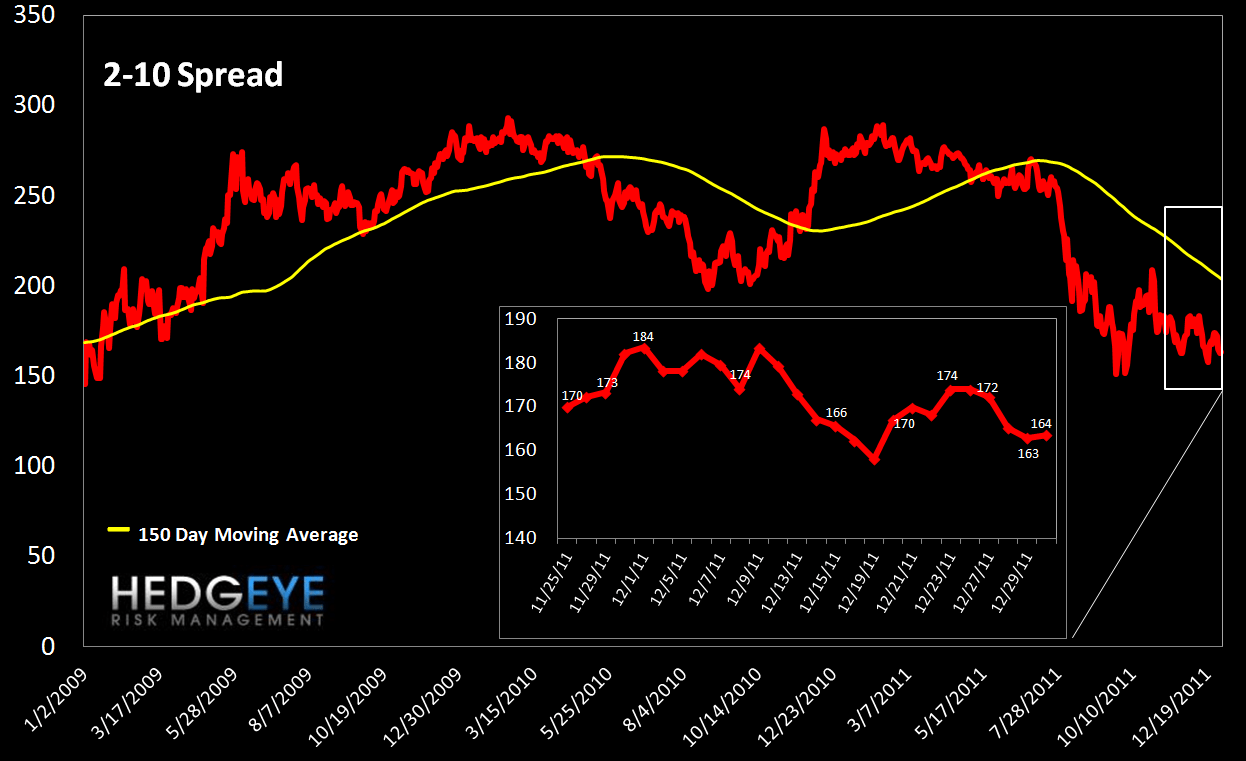
12. 2-10 Spread – We track the 2-10 spread as an indicator of bank margin pressure. Last week the 2-10 spread tightened to 164 bps, a decline of 10 bps from a week ago.
13. XLF Macro Quantitative Setup – Our Macro team’s quantitative setup in the XLF shows 3.2% upside to TRADE resistance and 3.2% downside to TRADE support.
Margin Debt in November
We publish NYSE Margin Debt every month when it’s released.
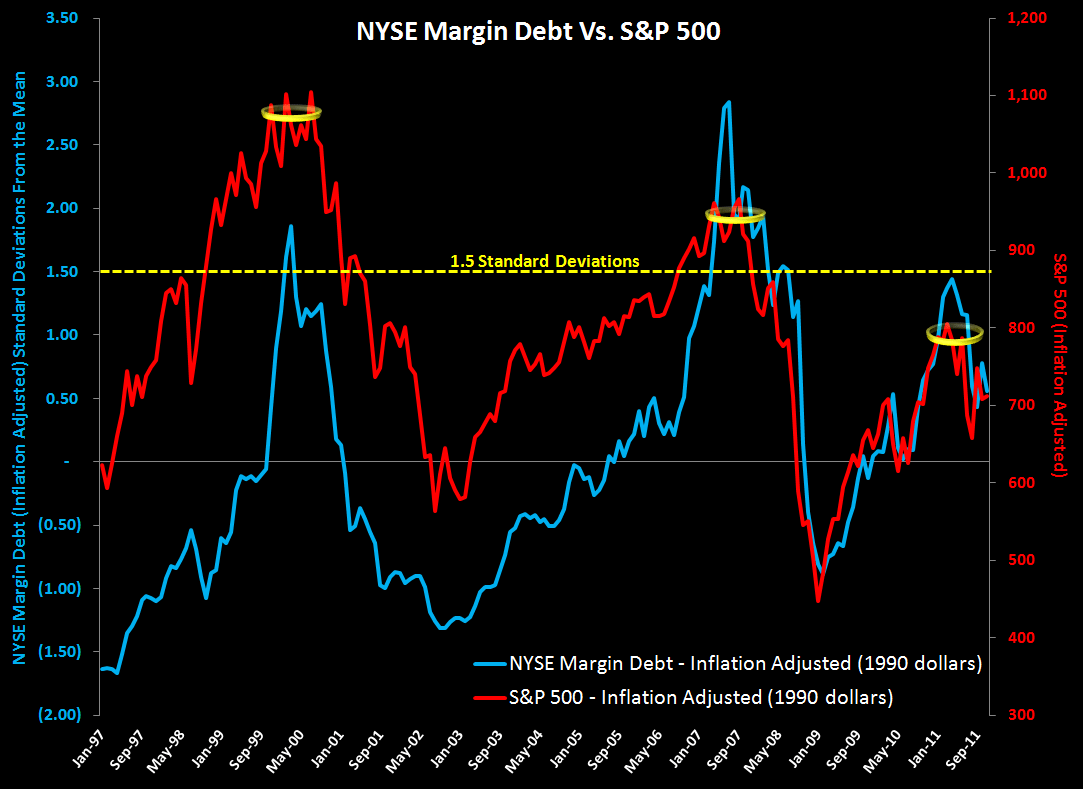
NYSE Margin debt hit its post-2007 peak in April of this year at $320.7 billion. The chart below shows the S&P 500 overlaid against NYSE margin debt going back to 1997. In this chart both the S&P 500 and margin debt have been inflation adjusted (back to 1990 dollar levels), and we’re showing margin debt levels in standard deviations relative to the mean covering the period 1. While this may sound complicated, the message is really quite simple. First, when margin debt gets to 1.5 standard deviations or greater, as it did this past April, that has historically been a signal of extreme risk in the equity market - the last two times it did this the equity market lost half its value in the ensuing period. We flagged this for the first time back in May of this year. The second point is that margin debt trends tend to exhibit high degrees of autocorrelation. In other words, the last few months’ change in margin debt is the best predictor of the change we’ll see in the next few months. This is important because it means that margin debt, which retraced back to +0.43 standard deviations in September, still has a long way to go. We would need to see it approach -0.5 to -1.0 standard deviations before the trend reversed. There’s plenty of room for short/intermediate term reversals within this broader secular move, as we saw in October and November’s print of +0.78 and +0.55 standard deviations. But overall, this setup represents a material headwind for the market.
One limitation of this series is that it is reported on a lag. The chart shows data through November.
Joshua Steiner, CFA
Allison Kaptur
Robert Belsky
Trouble viewing the charts in this email? Please click the link at the bottom of the note to view in your browser.
