Over the past 20 years, NKE has outperformed the S&P500 in 9 out of the 10 Olympic event years by an average spread of ~18%. More importantly, Nike has shown stronger gains relative to the S&P in Summer Olympic years, a la London, vs. Winter years.
Our call on Nike goes far beyond a single sporting event. In addition, my view is that once someone holds up a chart like the one below, the ‘trade’ is known and should therefore cease to exist.
But as much as we hold on to such logic, we cannot argue with math. The math here is very clear.
Key Takeaways:
- NKE has outperformed the S&P 500 by ~25% during Summer event years & ~12% during Winter event years over the last 2 decades (note: 1992 performance is included in both the Summer & Winter calculations).
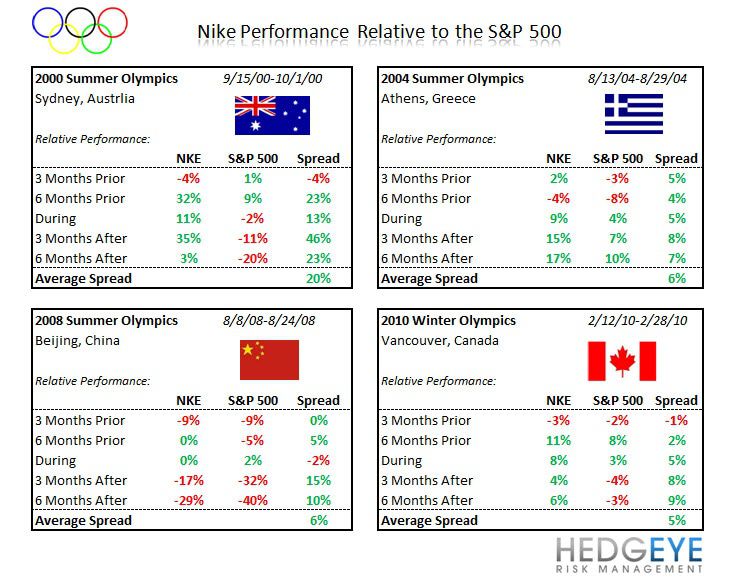
- From a timing perspective, over the last 3 Summer Olympic event years (Beijing, Athens, Sydney), NKE has significantly outperformed the S&P benchmark in the 3-6 month period following the event.