Note, as it relates to mix between footwear, apparel and equipment, the major athletic retailers stack up as follows.

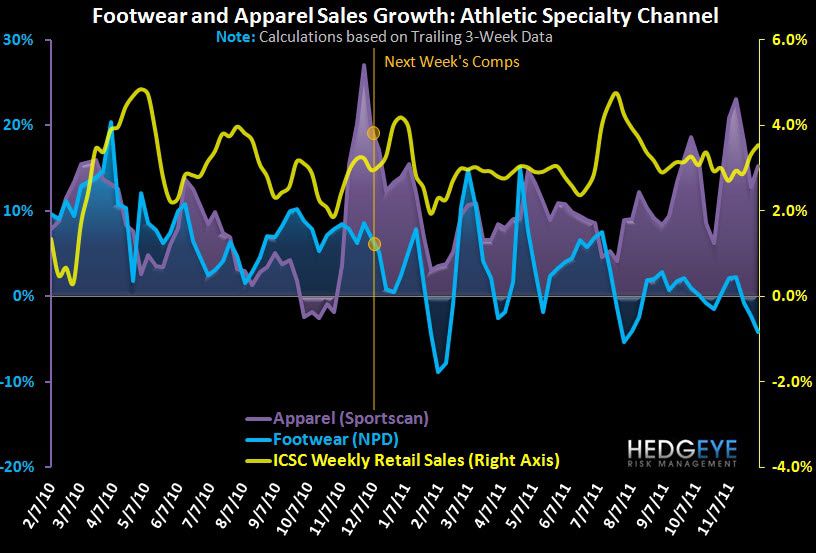
We’re seeing a continuation of the trends that emerged over the past few weeks. Apparel up, footwear down.
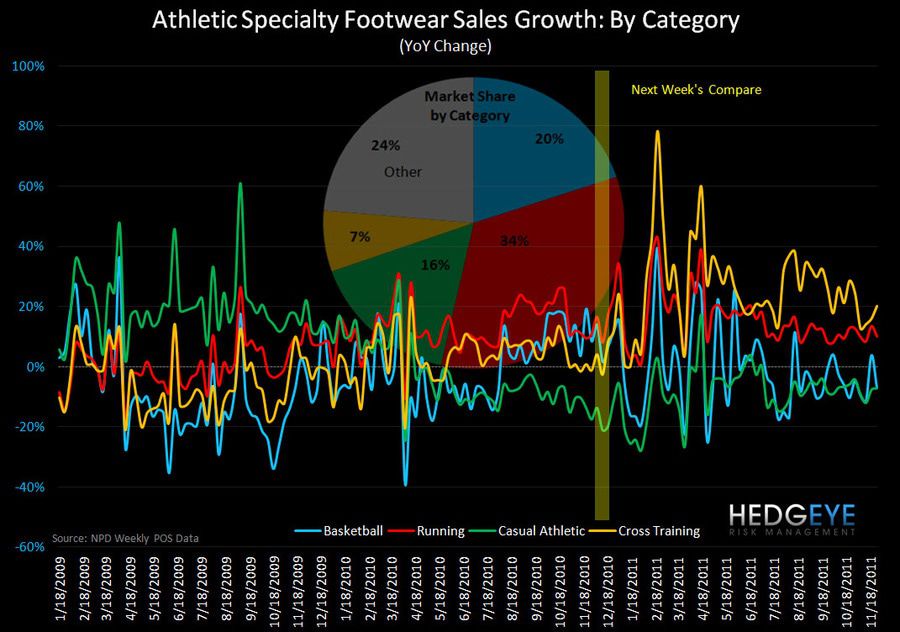
Athletic Apparel trends were strong last week posting a sequential acceleration as compares start to ease headed into the holidays. Underlying trends remain intact with the trailing 3-week rate increasing to 15% from 13% and 2Yr trends still running in the high-teens. Footwear sales, however, continued to the downside with growth slowing in running (~34% of FW) and Basketball (~20% of FW). We had been seeing a bifurcation in the basketball category, in that ‘performance’ shoes continued to post negative growth (-5%), while ‘hoops-inspired’ (~45% of total basketball) showed more signs of life. This trend reverted this week with the “inspired” category deteriorating sequentially down -11% from +10% (See Chart Below).
Perhaps most notable in the athletic apparel space is the continued strength in ASPs, which are +LSD-MSD again this week in the face of the ASP boost last year that started in mid-November. This is consistent with recent trends reflecting less elasticity in specialty athletic compared to both the discount/mass and family channels.
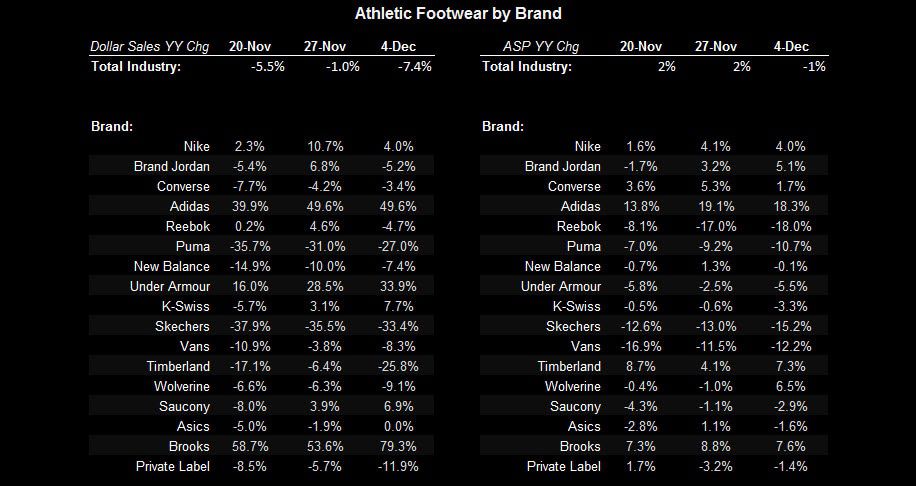
Here is some additional color on last week’s brand/category performance:
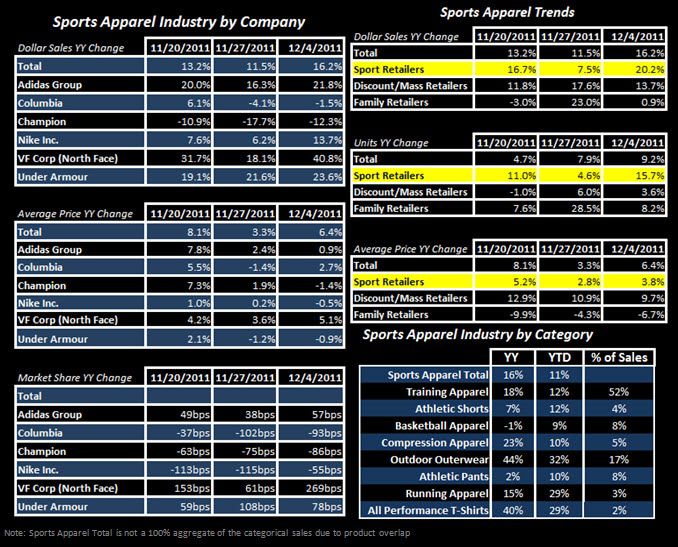
- Top line trends in all of the primary apparel categories improved on the margin. The most significant accelerations came in the compression and outerwear categories, which improved from +5% to +23% (good for UA) and +27% to +44% (good for VF), respectively.
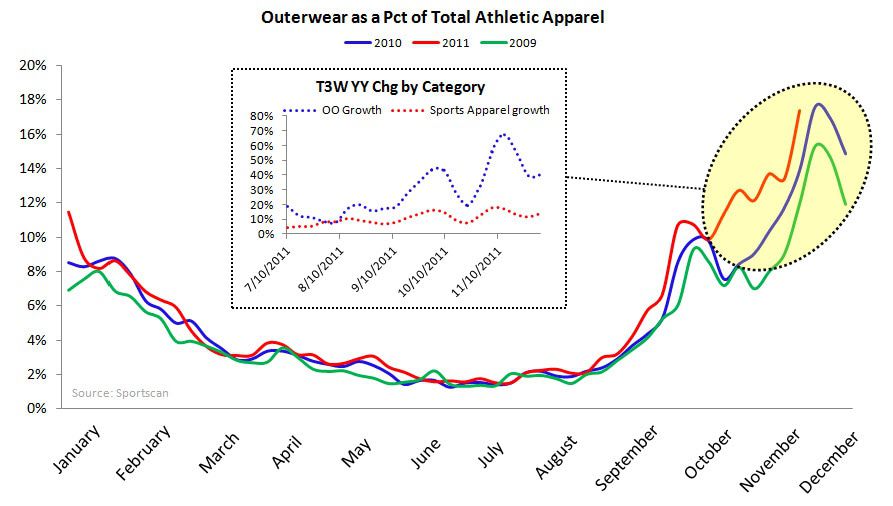
- An interesting callout is that last week was the warmest first week of December in 10 years. While we’d expect better traffic coming through the stores, we wouldn’t think that cold weather gear would be high on the list. But we continue to see share gains in outerwear despite a strong start to the season (see chart below). The North Face gained 270 bps while COLM lost 93 bps of market share.
- All of the apparel brands’ top line performance improved sequentially which is representative of widespread industry performance improving into December.
- Champion continues to be the primary underperformer in apparel with sales down 12.3% to the tune of an 86 bps loss in share. Again, we’d note that Champion is performing well at TGT, which is not represented in this data. But it also shows how the market is a zero sum game.
- Nike apparel had a nice spike last week, with sales growth improving sequentially up 12% from 7%, and 17% from 5% for men’s and women’s respectively.
- Nike apparel has been erratic, but it’s core footwear business remains strong -- up nearly 400 bps in share.
- FW sales at price points greater than $100 were negative for the first time in 4 months (Chart Below). While 85% of the athletic FW industry (per NPD) is made up of shoes below the $100 price point, the negative data point is indicative of the week’s overall underperformance.
- UA continues to gain momentum in footwear, with its top line accelerating on the margin. This is exactly what UA needs to show in order to clear its inventory glut. While 33% growth off of such a low base is not much in dollars, the brand is actually in the early stages of gaining share in the FW market.