VIP hold played a role but Mass was very strong.
November gross gaming revenues (GGR) increased 32% YoY to $2.88BN. Despite facing a difficult YoY hold comparison, November 2011 was an even luckier month which gave revenues a slight boost. Total direct play this month was 6.4% of the market, compared to 7.3% last year. The total market held at 3.13% vs. 3.08% in November 2010. Accounting for direct play and theoretical hold of 2.85% in both months, November revenues would have increased 31% YoY. Had hold been normal, GGR would've been 5% lower. High margin Mass business increased 40%, in-line with the 40% growth we’ve seen during the last 6 months.
Some other observations include:
- Despite the drop in market share, MPEL’s Rolling Chip volume was very strong and its Mass business gained share. MPEL posted its lowest market share since December 2009 but Mass share in November was the company’s highest ever. VIP hold percentage was the lowest among the operators which more than offset VIP volume that was in-line with recent trend. From a profitability perspective, high margin Mass is where it's at and MPEL continues to knock the cover off the ball.
- Wynn and LVS held the highest in the market in November
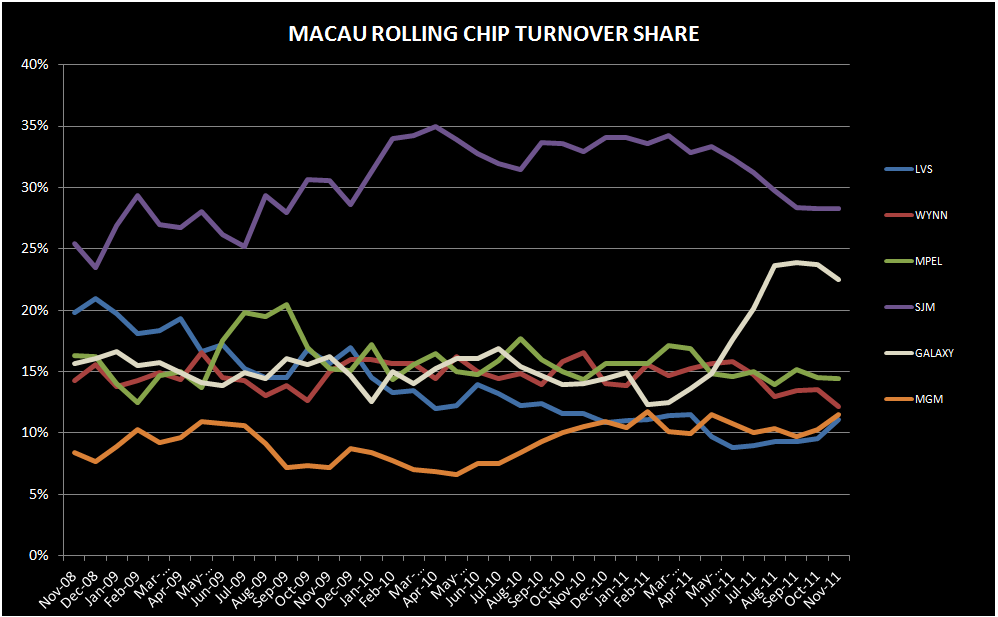
- Wynn’s VIP Rolling Chip volume share was its lowest ever at 12.2% while its mass share was the lowest in over a year. We think the VIP trend continues unless Wynn improves its junket offering. There’s not much they can do in the Mass space as growth continues to be concentrated on Cotai.
- LVS generated its lowest Mass share ever. Their junket push, however, appears to be paying dividends as Rolling Chip volume share climbed back to pre-Galaxy Macau levels owing to the opening of the Neptune tables and more aggressive junket credit. We’ll see how this junket for direct/Mass tradeoff works out from a profitability standpoint.
As we approach the next 2 months of the year, we expect YoY growth rates to decelerate, partly due to difficult hold comparisons and trends we are seeing in our sequential monthly projections (see “MACAU: EYE ON NOVEMBER” published on 11/2/11). Hold rates for December 2010 and January 2011 were approximately 3.15% and 3.10%, respectively. Normal hold levels would alone shave roughly 10% off YoY growth.
Y-o-Y Table Revenue Observations
Total table revenues grew 33% YoY this month, on top of 43% growth last November. November Mass revs rose 40%; VIP revs grew 30%; and Junket RC rose 30%.
LVS
Table revenues grew 35% YoY, showing a huge lift compared to recent trends due to the opening of junket rooms at Four Seasons. While the Venetian saw improved results, junket RC volume actually decreased slightly YoY. As we’ve written in several past notes, including last month’s review, we’ve heard that LVS has been extending additional junket credit and 2 new junkets are coming online at the Four Seasons this month. Neptune opened its rooms on November 1st.
- Sands was up 9% YoY. While hold was low, the comparison from November 2010 was also easy.
- Mass was up 17%
- VIP was up 4%. Sands held poorly in November. Assuming 15% direct play (in-line with 3Q11), hold was just 2.43% vs. 2.45% last November assuming the same level of direct play (also in-line with 4Q10)
- Junket RC was up 4%
- Venetian was up 24% YoY, driven by a Mass increase of 18% and a 27% increase in VIP
- Junket VIP RC fell slightly, down 1%
- Assuming 23% direct play in the quarter (just slightly below the 24% we saw in 3Q11), hold was 3.5% compared to 2.8% hold in November 2010 assuming 19% direct play (in-line with 4Q10)
- Four Seasons grew 227% YoY, driven by a tripling (297%) of YoY VIP revenue and to a much lesser extent, 53% increase in Mass revenues.
- Junket VIP RC increased 2.5x YoY
- Four Seasons is clearly seeing a benefit from LVS’s recent initiatives plus an easy YoY hold comparison. If we assume that monthly direct play volume was in the neighborhood of recent trends - ~550MM, that implies a direct play percentage of 23% and a hold rate of 2.94%. In comparison, if November 2010 direct play was in-line with the rest of 4Q10 at 54% then hold was just 1.35%.
WYNN
Wynn table revenues were up just 4%, exhibiting the slowest growth of the 6 concessionaires, despite high hold. As we’ve written about in “Macau Observations” on 11/16, Wynn is in a bit of pickle given LVS’s recent initiatives, the general continued shifts of play to Cotai, and the general constraints at the property.
- Mass was up 21% and VIP increased 1%
- Junket RC decreased 5% - the first YoY decrease since August 2009
- Assuming 10% of total VIP play was direct (in-line with 3Q11), we estimate that hold was 3.6% compared to 3.4% last year (assuming 11% direct play – in-line with 4Q10)
MPEL
Table revenues grew 15% - driven primarily by 72% growth in Mass and 4% growth in VIP
- Altira revenues declined 7%, due to a 11% decline in VIP somewhat moderated by a 41% lift in Mass growth. VIP revenues were negatively impacted by lower than normal hold and difficult comparisons.
- VIP RC increased 17%
- We estimate that hold was 2.7% vs. 3.6% last year (direct play is not material at Altira)
- CoD table revenue was up 30%, driven by 79% growth in Mass and 17% growth in VIP – negatively impacted by low hold and a difficult hold comparison
- Junket VIP RC grew 43%
- Assuming a 15.5% direct play level, hold was 2.7% in November compared to 3.1% last year
SJM
Revs grew 15% in-line with October growth
- Mass was up 77% and VIP was up 10%
- Junket RC was up 12%
GALAXY
Table revenues continued its streak of triple-digit gains, +166%; Mass soared 272%, while VIP gained 152%
- StarWorld table revenues grew 38%
- Mass grew 45% and VIP grew 37%, helped by high hold and an easy comp
- Junket RC grew 28%
- Hold was high at 3.31% compared to normal hold of 2.85% hold last November
- Galaxy Macau's total table revenues were $282MM, 17% lower than October’s seasonal high but 17% higher than September’s
- Mass table of $56MM, down $3MM from October but up $10MM from September
- VIP table revenue of $226MM, a 19% MoM decrease, despite high hold of 3.5% compared to 3.4% in October.
- RC volume of $6.5BN compared to $8.3BN in October, $7BN in September and $7.9BN in August
MGM
Table revenues increased 25% YoY, helped by high hold in the quarter
- Mass revenue growth was 10%, while VIP grew 28%
- Junket RC increased 41%
- Assuming a direct play level of 8%, we estimate that hold was 3.1% this month vs. 3.3% in November 2010, assuming direct play of 11%
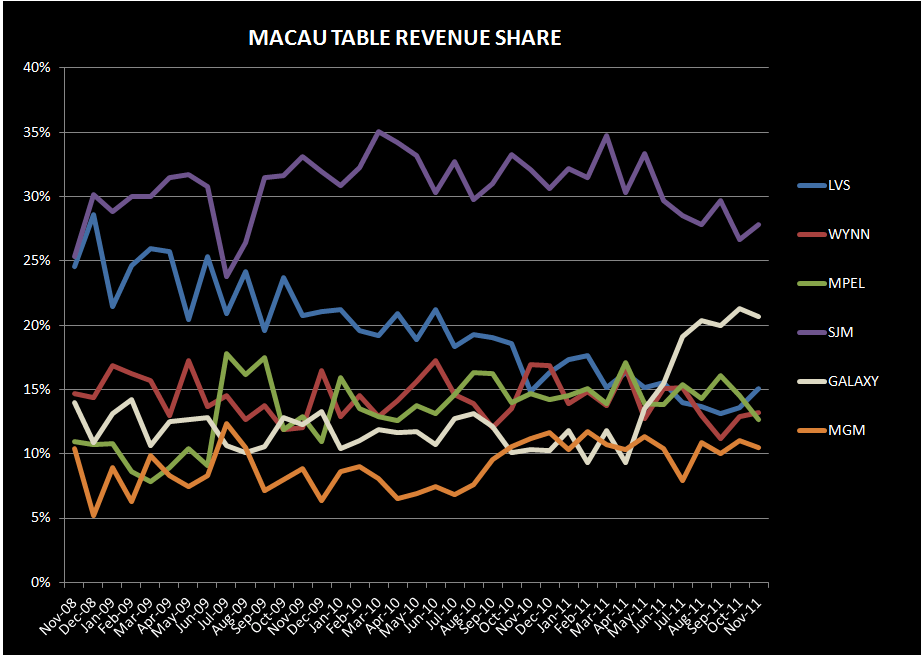
Sequential Market Share
LVS
LVS was the big share gainer in November. Share increased 1.6% sequentially to 15.6%. This compares to 6 month trailing market share of 14.7% and 2010 average share of 19.5%
- Sands' share increased 50bps to 4.0%
- Both Mass and VIP rev share increased 30 bps
- Venetian’s share remained flat at 8.1% share
- VIP share improved 80bps to 6.7%, above the prior TTM average of 6.5%
- Mass share dropped 3% sequentially to 12.5% - an-all time low for the property
- Junket RC remained flat at 4.7%
- FS share improved 1% to 3.0%
- VIP share increased 1.6% to 3.4% the best share since January 2011
- Mass share dropped 70bps to 1.6%
- Junket RC improved 140bps to 2.9%
WYNN
Wynn’s share ticked up 20bps to 13.3% share - although still below its 6 month trailing average share of 13.6% and well below its 2010 average share of 15%. Wynn’s share should continue to struggle with the opening of Sands Cotai Central in March and with the ramp of new junkets at the Four Seasons.
- Mass market share fell 90bps to 12.3%
- VIP market share increased 90bps to 14.5%
- Junket RC share fell 1.3% to 12.2% - the lowest share since October 2007. This compares to Wynn’s 6 month trailing average of 14.4% and 2010 average of 15.2%.
MPEL
MPEL had the largest share loss in November. Market share fell 1.7% points to 12.9% - its lowest share since October 2009. This compares to their 6 month trailing share of 14.8% and 2010 share of 14.6%.
- Altira share fell 50bps to 4.2%, below the property’s 2010 share of 5.6%. Mass share improved 40bps while VIP share dropped 60bps.
- CoD’s share dropped 140bps to 8.4% driven by share losses in VIP (which was impacted by hold) that were partly offset by strength in Mass
- Mass market share increased 1.2% points to 10.4% - an all-time high record for the property
- VIP share fell 2.3% to 7.8%
SJM
SJM gained 1.2% share in November to 27.2%, which was still below their 6-month trailing average of 28.6% and below their 2010 average of 31.3%.
- Mass market share increased 2.6% to 36.6% - off all-time lows in October
- VIP share improved 50bps to 25.0%
- Junket RC share was flat at 28.3%
GALAXY
Galaxy lost 60bps to 20.3%. November share compares with an average share of 10.9% in 2010 and a 6 month trailing average of 18.0%.
- Galaxy Macau share declined 30bps to 10.2%
- Mass share ticked up 10bps to 8.3%
- VIP market share fell 40bps to 10.8%
- RC share ticked down 40bps to 10.4%
- Starworld lost 40bps of market share to 8.8%, 30bps below its TTM share of 9.1% pre-Galaxy Macau level.
MGM
Lost 60bps to 10.6% due to share losses in VIP share. November share compares with an average share of 10.3% in 2010 and a 6 month trailing average of 10.4%.
- Mass share increased 20bps to 7.1% but was more than offset by a 70bps decrease in VIP share to 11.6%
- Junket RC gained 1.2% share to 11.5%, above the property’s 2010 average of 8.4% and above its 6 month trailing average of 10.4%
Slot Revenue
Slot revenue grew 25% YoY – for a total of $33MM – flat sequentially.
- As expected, GALAXY slot revenues grew the most with 356% YoY to $13MM
- MGM slot revenues had the second best growth at 35% YoY to $16MM
- LVS slot revenues grew 28% YoY to $33MM
- SJM slot revenues grew 13% YoY to $14MM
- MPEL slot revenues grew 7% YoY to $21MM
- WYNN slot revenues fell 6% YoY to $18MM – the lowest absolute level since June 2010