Trouble viewing the charts in this email? Please click the link at the bottom of the note to view in your browser.
* Last week was a sea of red across our risk monitor categories. Most notable were the following:
* The TED spread made another new YTD high at 50.3 bps. As a reminder, while this is well below 2008 for structural reasons, the important consideration here isn't the level, but the trend. Higher TED spread prints continue to indicate risk in the banking system is still rising. Until we see a cooling off in the TED spread investors should remain defensively positioned, as the systemic risks have been properly addressed.
*Credit default swaps for Eurozone countries were generally wider. German swaps were particularly noteworthy, widening by 15% to 111 bps.
*Credit default swaps for European banks widened 16% last week, on average. There is a sharp divergence between the Scandinavian/UK/Swiss banks and the rest of the group.
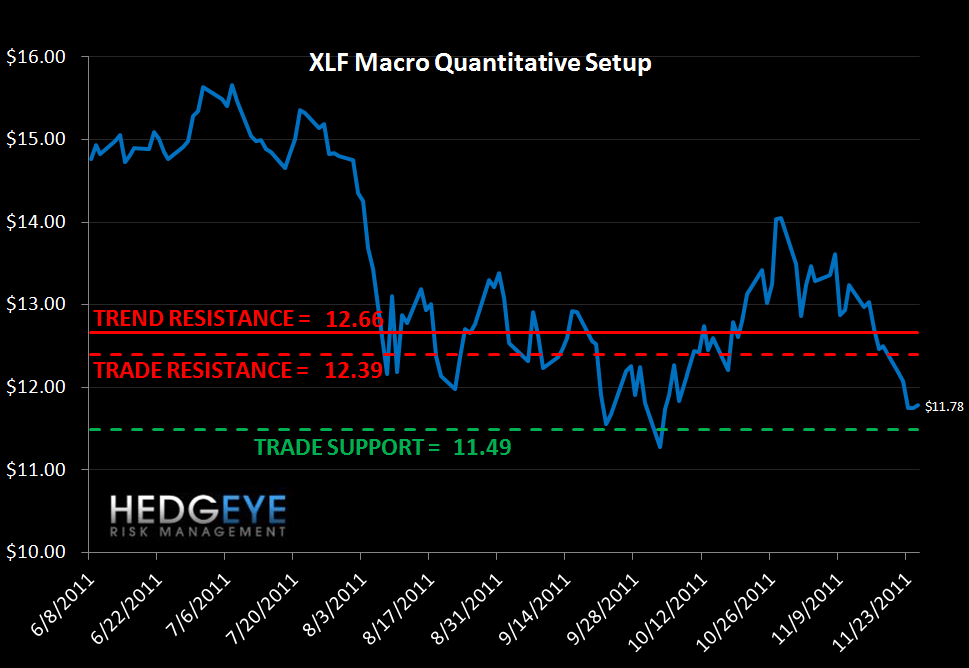
* Short-term Silver Lining: Our macro quantitative model indicates that in the short term (TRADE), there is currently around 2 times more upside than downside in the XLF (5.2% upside vs. 2.5% downside).
Financial Risk Monitor Summary (Across 3 Durations):
- Short-term (WoW): Negative / 0 of 11 improved / 7 out of 11 worsened / 4 of 11 unchanged
- Intermediate-term (MoM): Negative / 0 of 11 improved / 9 of 11 worsened / 2 of 11 unchanged
- Long-term (150 DMA): Negative / 1 of 11 improved / 8 of 11 worsened / 2 of 11 unchanged

1. US Financials CDS Monitor – Bloody. Swaps widened for all 27 major domestic financial company reference entities last week.
Widened the most vs last week: BAC, PRU, XL
Widened the least vs last week: COF, CB, AGO
Widened the most vs last month: GS, MS, PRU
Widened the least vs last month: MBI, AGO, MMC

2. European Financials CDS Monitor – A Sea of Red. Bank swaps were wider in Europe last week for 35 of the 40 reference entities. The average widening was 5.4% and the median widening was 16.1%. Bank swaps remain below 300 in Norway, Sweden, Switzerland, and the UK. Across the 29 banks in Austria, Belgium, Denmark, France, Germany, Greece, Italy, Portugal, Russia, Scotland, and Spain, there is only one bank with swaps trading below 300 bps. While no one needs reminding that the systemic risk in the European banking system is extraordinarily high, this morning's data serves as a reminder nonetheless.

3. European Sovereign CDS – European sovereign swaps mostly widened last week. German sovereign swaps widened by 15.3% (+15 bps to 111.5) and American swaps by 7.8% (+4 bps to 55.5).


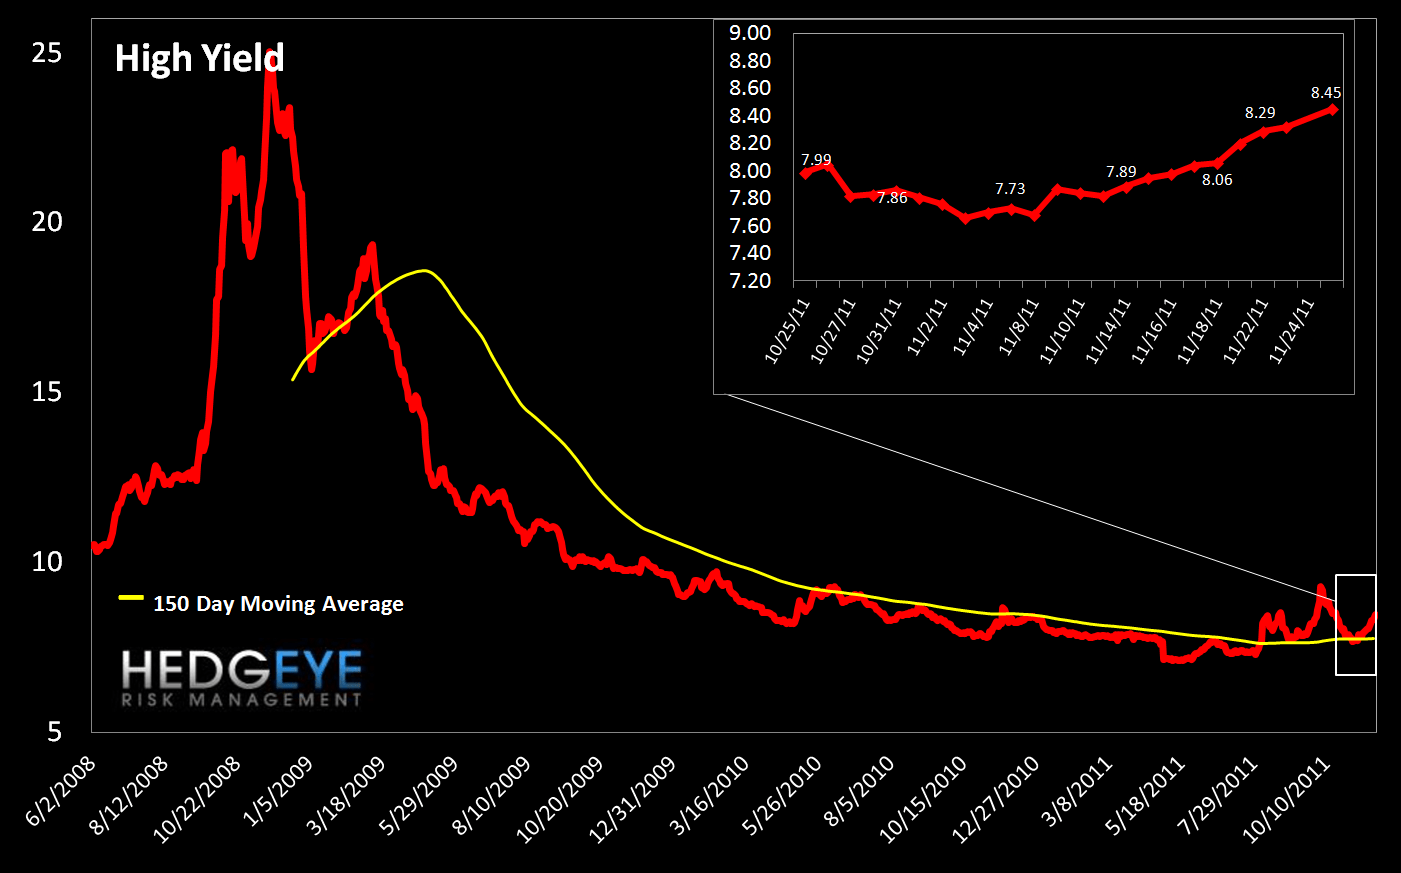
4. High Yield (YTM) Monitor – High Yield rates rose 39 bps last week, ending the week at 8.45 versus 8.06 the prior week.
5. Leveraged Loan Index Monitor - The Leveraged Loan Index fell 15 points last week, ending at 1572.

6. TED Spread Monitor – The TED spread rose 1.5 points last week, ending the week at 50.3 this week, a new YTD high.
The TED spread has eclipsed its highs from April/May 2010 and now stands at its highest level since May 2009.

7. Journal of Commerce Commodity Price Index – The JOC index fell 1.4 points, ending the week at -24.16 versus -22.78 the prior week. Negative commodity momentum is reflective of the strong Dollar, which is benefiting from the weak Euro.

8. Greek Yield Monitor – The 10-year yield on Greek debt rose on Thursday to 2988 bps, a new all time high, but retreated 1 bp on Friday and ended 168 bps higher over last week at 2987 bps.

9. Markit MCDX Index Monitor – Worsening. The Markit MCDX is a measure of municipal credit default swaps. We believe this index is a useful indicator of pressure in state and local governments. Markit publishes index values daily on six 5-year tenor baskets including 50 reference entities each. Each basket includes a diversified pool of revenue and GO bonds from a broad array of states. We track the 14-V1. Last week spreads widened, ending the week at 193 bps versus 183 bps the prior week.

10. Baltic Dry Index – The Baltic Dry Index measures international shipping rates of dry bulk cargo, mostly commodities used for industrial production. Higher demand for such goods, as manifested in higher shipping rates, indicates economic expansion. Last week the index fell 88 points, ending the week at 1807 versus 1895 the prior week.

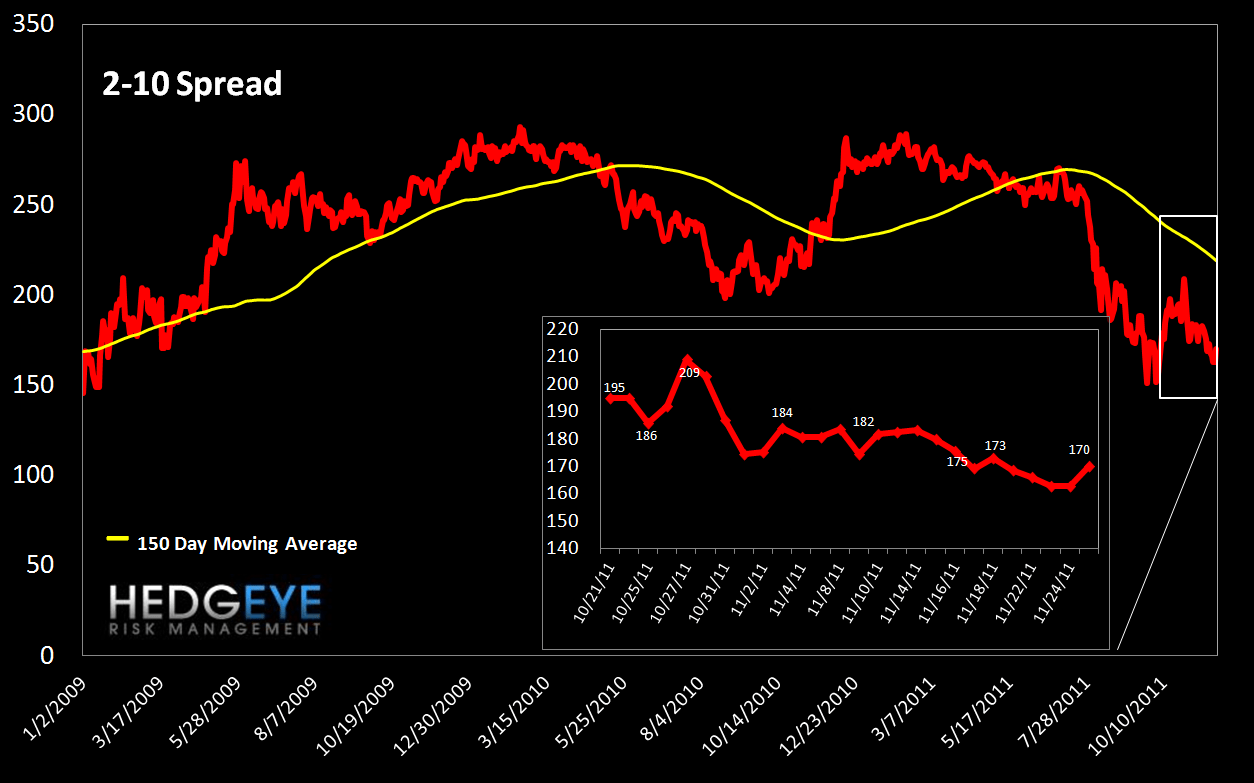
11. 2-10 Spread – We track the 2-10 spread as an indicator of bank margin pressure. Last week the 2-10 spread tightened to 170 bps, 3 bps tighter than a week ago.
12. XLF Macro Quantitative Setup – Our Macro team’s quantitative setup in the XLF shows 5.2% upside to TRADE resistance and 2.5% downside to TRADE support.
Margin Debt in October
We publish NYSE Margin Debt every month as soon as it’s released.
The chart below shows the S&P 500 overlaid against NYSE margin debt going back to 1997. In this chart both the S&P 500 and margin debt have been inflation adjusted (back to 1990 dollar levels), and we’re showing margin debt levels in standard deviations relative to the mean covering the period 1.
While this may sound complicated, the message is really quite simple. First, when margin debt gets to 1.5 standard deviations or greater, as it did this past April, that has historically been a signal of extreme risk in the equity market - the last two times it did this the equity market lost half its value in the ensuing period. We flagged this for the first time back in May of this year. The second point is that margin debt trends tend to exhibit high degrees of autocorrelation. In other words, the last few months’ change in margin debt is the best predictor of the change we’ll see in the next few months. This is important because it means that margin debt, which retraced back to +0.43 standard deviations in September, still has a long way to go. We would need to see it approach -0.5 to -1.0 standard deviations before the trend reversed. There’s plenty of room for short/intermediate term reversals within this broader secular move, as we saw in October’s print of +0.78 standard deviations. But overall, this setup represents an ongoing material headwind for the market.
One limitation of this series is that it is reported on a lag. The chart shows data through October.

Joshua Steiner, CFA
Allison Kaptur
Trouble viewing the charts in this email? Please click the link at the bottom of the note to view in your browser.
