Position: We sold our position in the Gold ETF (GLD) earlier today.
Earlier today, we sold our position in the Gold ETF (GLD) for a small loss of -3.6% in the Virtual Portfolio. Obviously, it is never enjoyable to take a loss, but, as it relates to our decision making process, it is actually pretty simple: we change our views as our factors change.
In the instance of gold, the inverse correlation with the U.S. dollar index has recently heightened (going from +0.08 on the 30-day duration to -0.45 on the 15-day duration) and our King Dollar thesis (bullish on the U.S. dollar) has not changed. Thus, in the shorter term it seems dollar up is likely to mean gold down, which is obviously not good for the long gold position.
The key catalyst for us with this sale was the price of gold. As outlined in the chart below, gold broke its TREND line of support at $1,724, which, according to our quantitative models, establishes the TAIL line of $1,559 as the next key line of support.
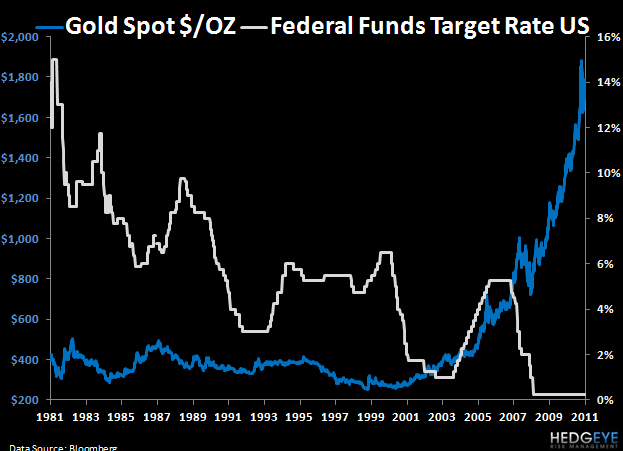
Longer term, the key reasons to own gold are in tact. First, inflation from fiat currencies is still, and will likely remain, a key support for the price of gold, especially as the size and scale of European sovereign debt bailout increases. Second, and as outlined in the chart below, when real interest rates are at, or below, zero, it provides a favorable backdrop for gold as investors search for return. (Incidentally, we don’t see a meaningfully increase in U.S. rates at least while Bernanke is at the helm.) Finally, gold continues to be a hedge for geopolitical risk, which is only accelerating in the Middle East due to concerns over the Iranian nuclear program and uncertainty over upcoming elections in Egypt.
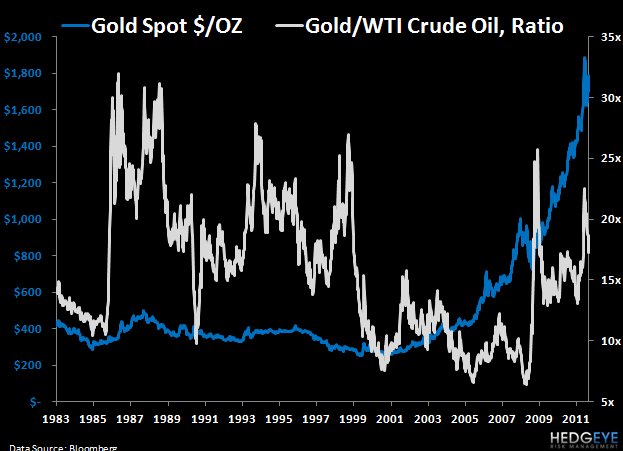
Unlike other asset classes, specifically bonds, real estate and equities, the challenge with gold is that it is difficult to value. As outlined above, it is typically used as a hedge against certain macroeconomic environments. That said, in the charts below, we took a look at gold versus WTI oil and the U.S. housing market.
On the first metric, gold can currently purchase ~17.3 barrels of oil. This is just above the long run average going back to 1983 of 15.7 and well off the highs of early 2009 when one ounce of gold could buy 25.7 barrels of oil. So, on this metric, gold is basically fairly priced, at least versus the last thirty years of data.
On the second metric relating gold and U.S. home prices, the data suggests gold may be more extended on valuation. Currently, a hundred ounces of gold will buy 1.06 houses in the U.S. based on the current median home prices. Almost ten years ago, a hundred ounces of gold would buys less than 0.19 of a U.S. house. This analysis, at least over the last decade, suggests that gold is at an elevated valuation. Longer term, going back to 1963 as highlighted in the second chart below, gold has traded higher versus U.S. home prices, so it actually remains well off its highs.


The key negative fundamental data point relating to gold is on the demand side of the equation. According to the most recent data from World Gold Council, global demand for gold was 919.8 tonnes in Q2 2011. This was down -17% on a volume basis from Q2 2010 and down -5% sequentially from Q1 2011. While the actual volumes were down, the dollar value actually increased year-over-year by 5% and sequentially by 2.8%. The implication for the recent demand figure is that there is some elasticity in demand and price increases.
Even if demand is more tepid at higher prices of gold, as long as interest rates in the U.S. remain near all time lows and Keynesian policies remain intact globally, the bullish TAIL position in gold should hold.
Daryl G. Jones
Director of Research
