Positions in Europe: Short EUR-USD (FXE); Short France (EWQ)
French Risk Rising: Below we update our chart of French 5YR CDS and the spread between France’s 10YR bond yield and bunds. In both cases, we continue to see higher highs since the EUR was introduced. We remain short France via the eft EWQ in the Hedgeye Virtual Portfolio due to:
- French debt could peak at 92.3% of GDP in 2013 (over the Reinhart &Rogoff 90% level that impedes growth), especially if the state has to take on more of the bank recapitalizations. Rough estimates suggest that France’s four largest banks need to raise over 40 Billion EUR to reach the 9% core tier 1 capital ratio.
- A lofty schedule of debt maturities (+200 Billion EUR over next 6 months) and higher trending yields will make raising debt more expensive and put upward pressure on debt. France has the largest banking exposures to Italy of any country and has yet to significantly mark down its PIIGS paper.
- GDP will take a hit, already revised down from 1.75% to 1% for 2012 by President Sarkozy. We think Austerity’s Bite and a prolonged effort by Eurocrats to keep the Eurozone fabric together will create an extended period of downside economic and market performance.
- A higher French unemployment rate (nearly 3% above Germany's) and the inability to drive economic growth through exports (like Germany) should prolong weakness in French fundamentals as stagflation takes hold into year end and in 2012.
- A huge risk remains the downgrade of France’s AAA credit rating, including jeopardizing the EFSF, a facility that is built on its AAA credit rating to raise debt at “cheap” levels, and of which France is the second largest contributor.

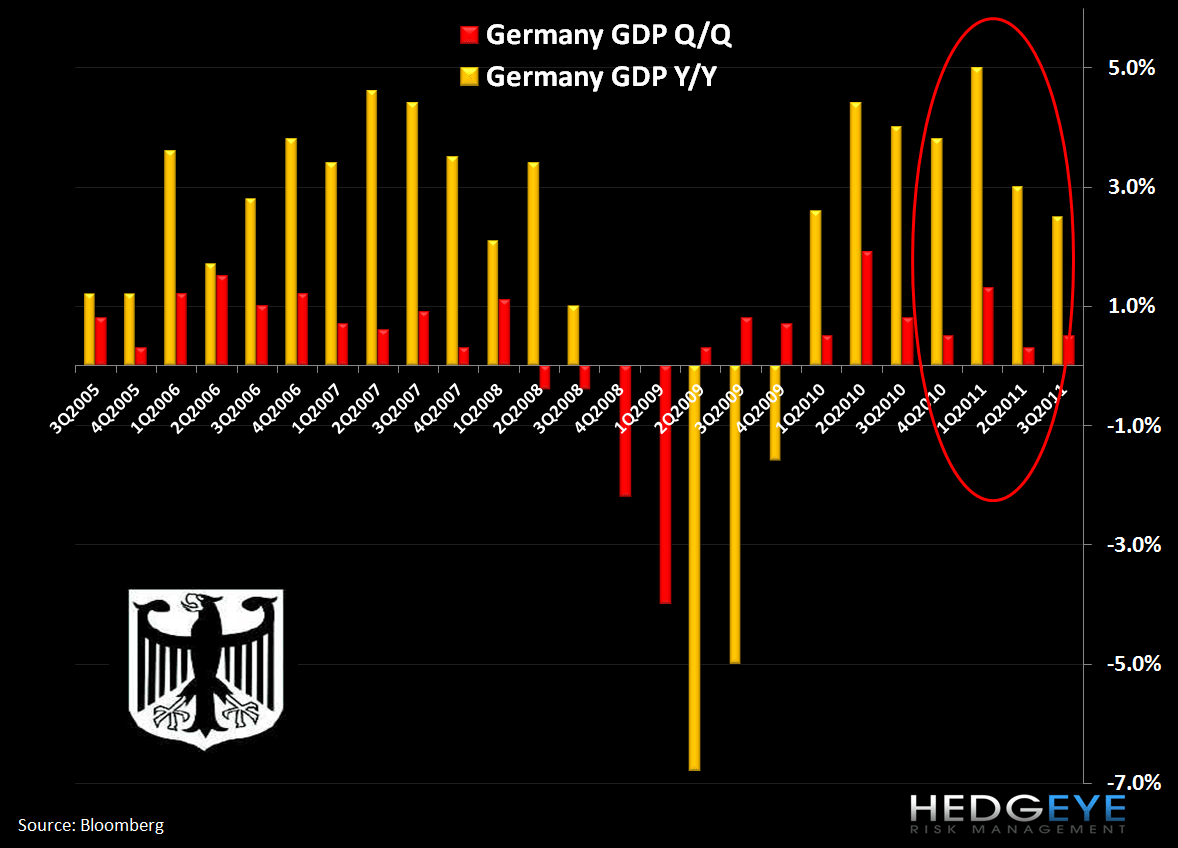
German GDP Slowing: Like much of the Europe, we expect German growth to slow over the next 4 quarters. A look at the chart below shows that from a comparative perspective, Germany will have tough comps on a quarter-over-quarter basis for Q4 (bumping against +0.5%) and should have 4 tough quarterly comps on a year-over-year basis (circled in red below in the chart).
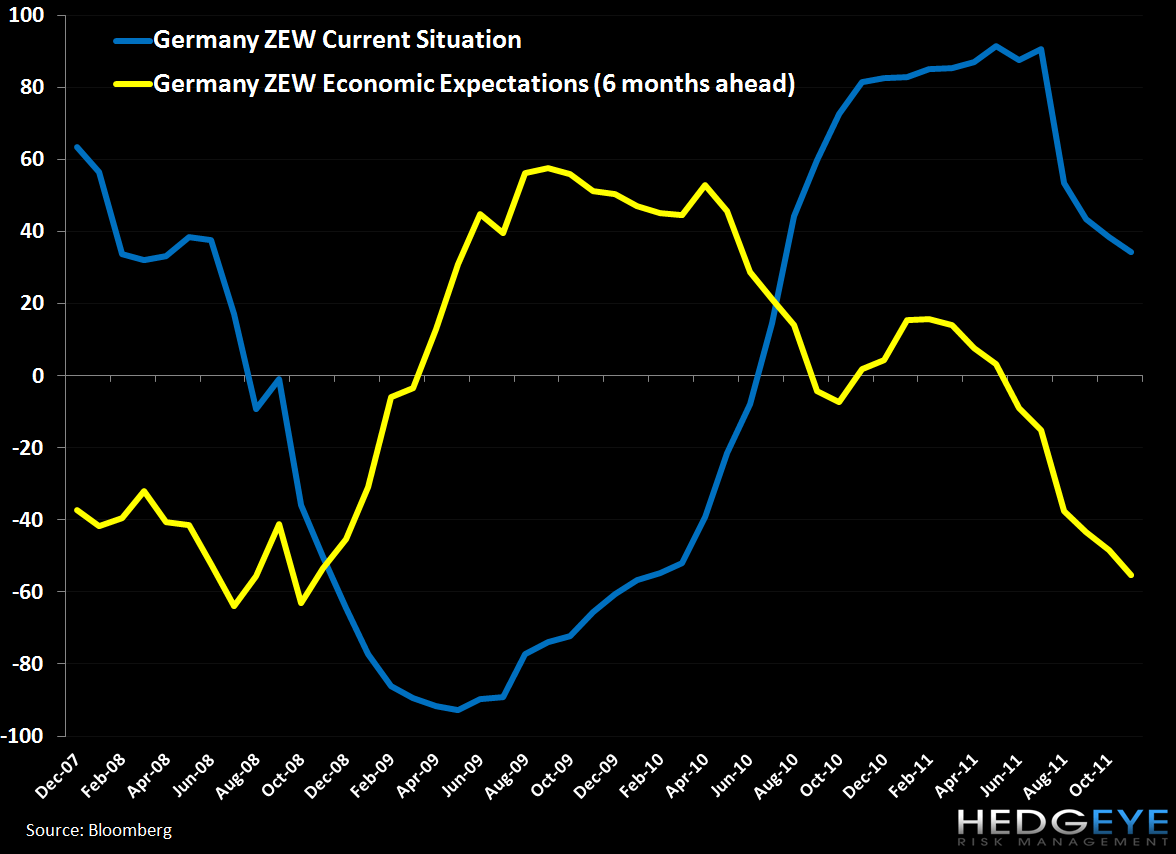
Further, readings from ZEW’s Economic Sentiment survey that is 6 months forward looking (yellow line in the second chart below) suggest similar downward pressure, recording a 3-year low of -55.2 in November.
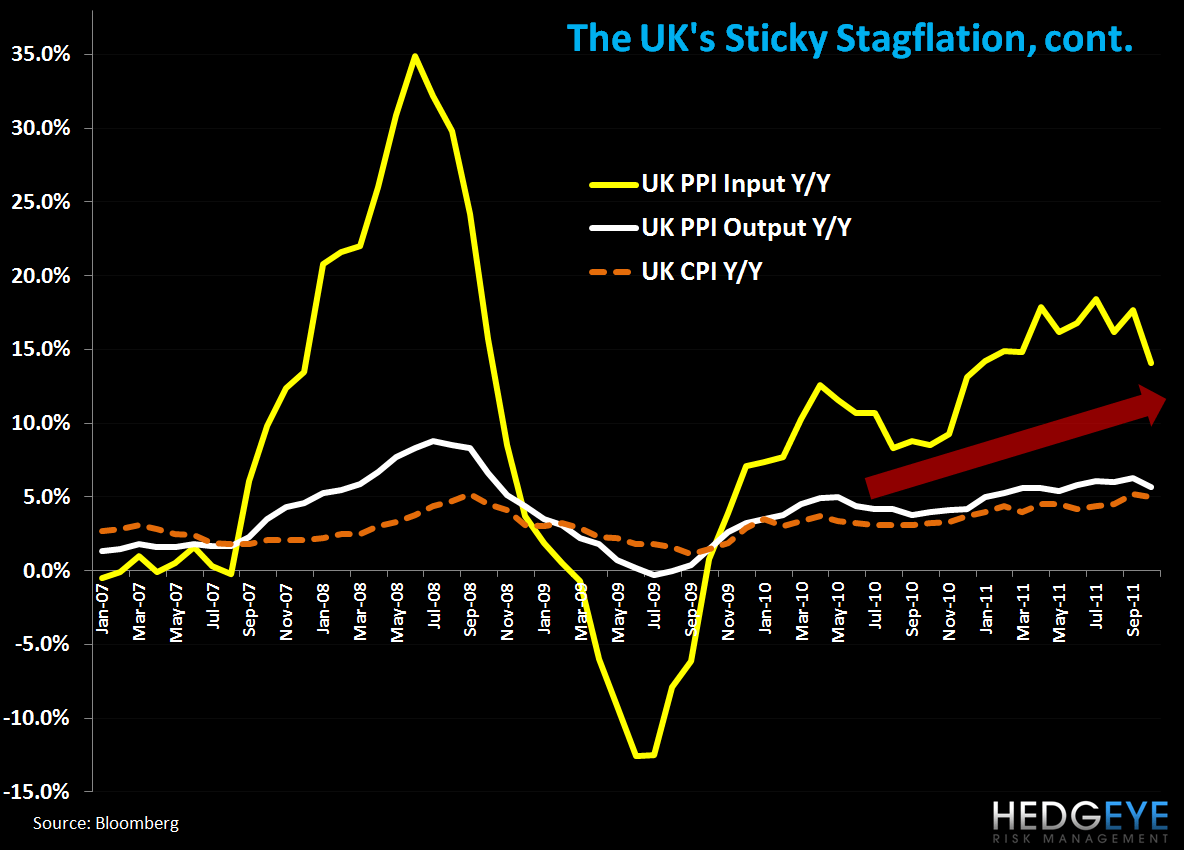
UK’s Sticky Stagflation: As the chart below demonstrates, UK inflationary metrics are running high (most current reading down 20bps vs the previous month at 5.0% in Oct. Y/Y), which will further crimp growth. For the UK, a fall in energy prices could materially depress many of these readings and could be its saving grace.
Matthew Hedrick
Senior Analyst
