Trouble viewing the charts in this email? Please click the link at the bottom of the note to view in your browser.
Credit default swaps for German and French banks were 20% wider last week, while Spanish and Italian CDS blew out to 399 and 516 respectively. Greek bond yields made a new all-time high, widening 353 bps. Early in the week, the TED spread made a new YTD high before retreating slightly.
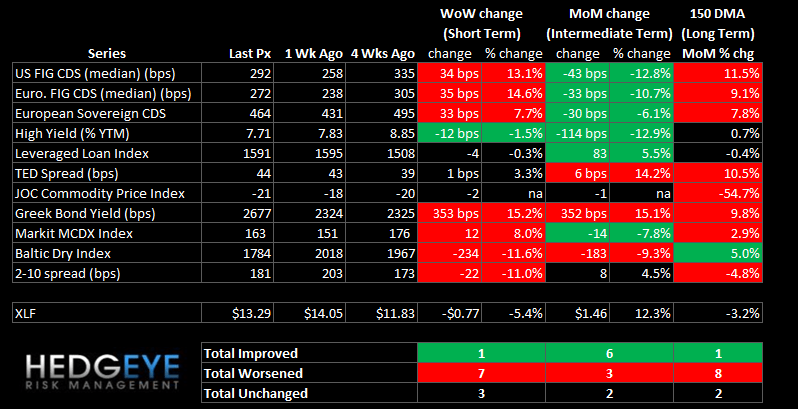
Financial Risk Monitor Summary (Across 3 Durations):
- Short-term (WoW): Negative / 1 of 11 improved / 7 out of 11 worsened / 3 of 11 unchanged
- Intermediate-term (MoM): Positive / 6 of 11 improved / 3 of 11 worsened / 2 of 11 unchanged
- Long-term (150 DMA): Negative / 1 of 11 improved / 8 of 11 worsened / 2 of 11 unchanged
1. US Financials CDS Monitor – Swaps widened for 26 of 28 major domestic financial company reference entities last week.
Widened the most vs last week: GS, MS, HIG
Widened the least/ tightened the most vs last week: MTG, MBI, GNW
Widened the most/ tightened the least vs last month: PMI, RDN, AGO
Tightened the most vs last month: LNC, MBI, HIG

2. European Financials CDS Monitor – Bank swaps were wider in Europe last week for 36 of the 40 reference entities. The average widening was 7.6% and the median widening was 14.6%. Swaps for Credit Agricole and the Deutsche Bank widened 31.7% and 31.3% respectively. The nine French and German banks we track saw swaps widen an average of 19%.

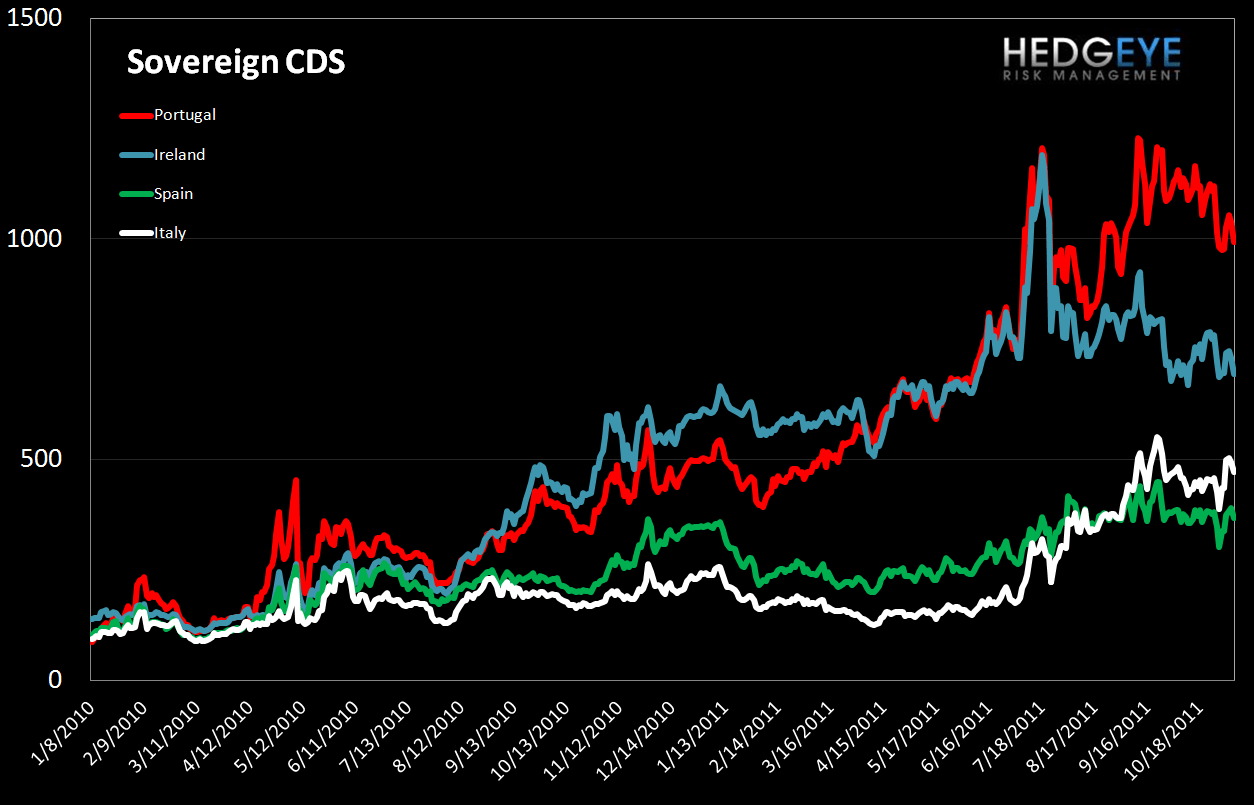
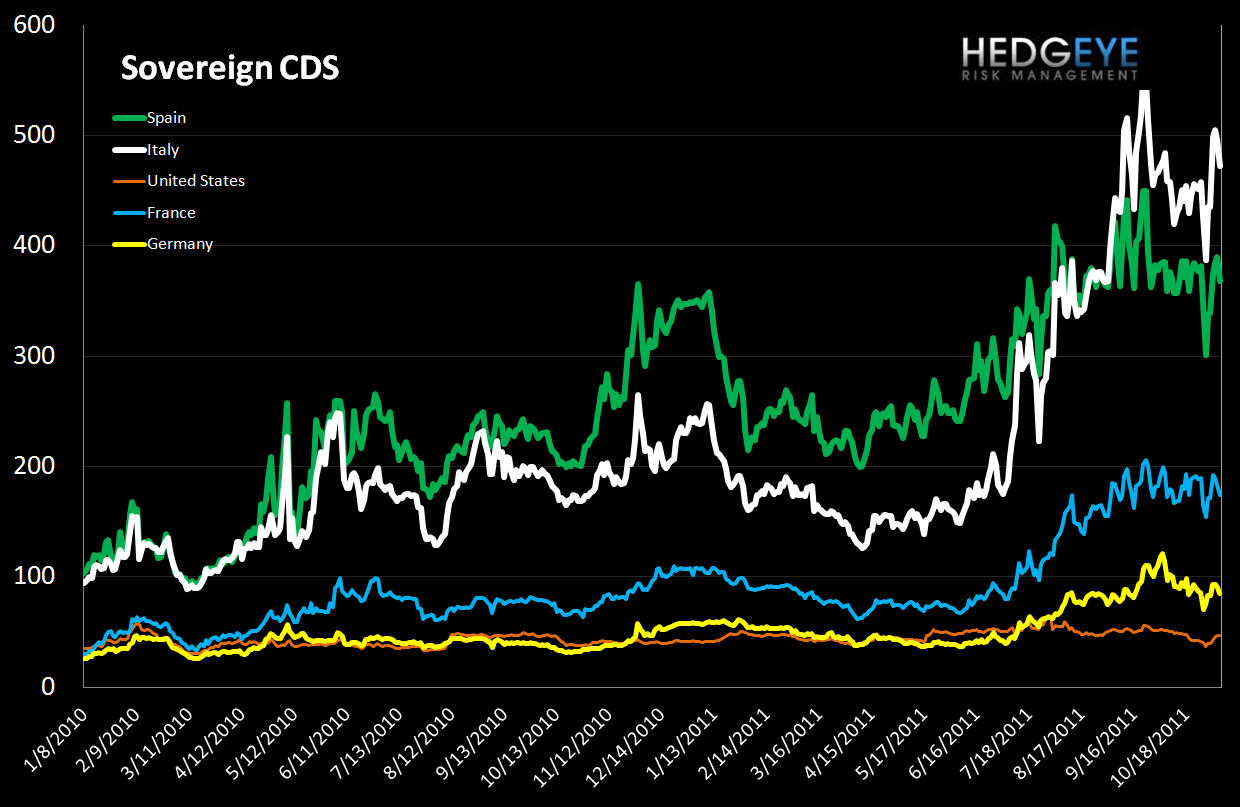
3. European Sovereign CDS – European sovereign swaps mostly widened last week. Spanish sovereign swaps widened by 18% (+60 bps to 399) and Italian by 19% (+82bps to 516). US CDS widened off a low base, rising from 40 bps to 48 bps.
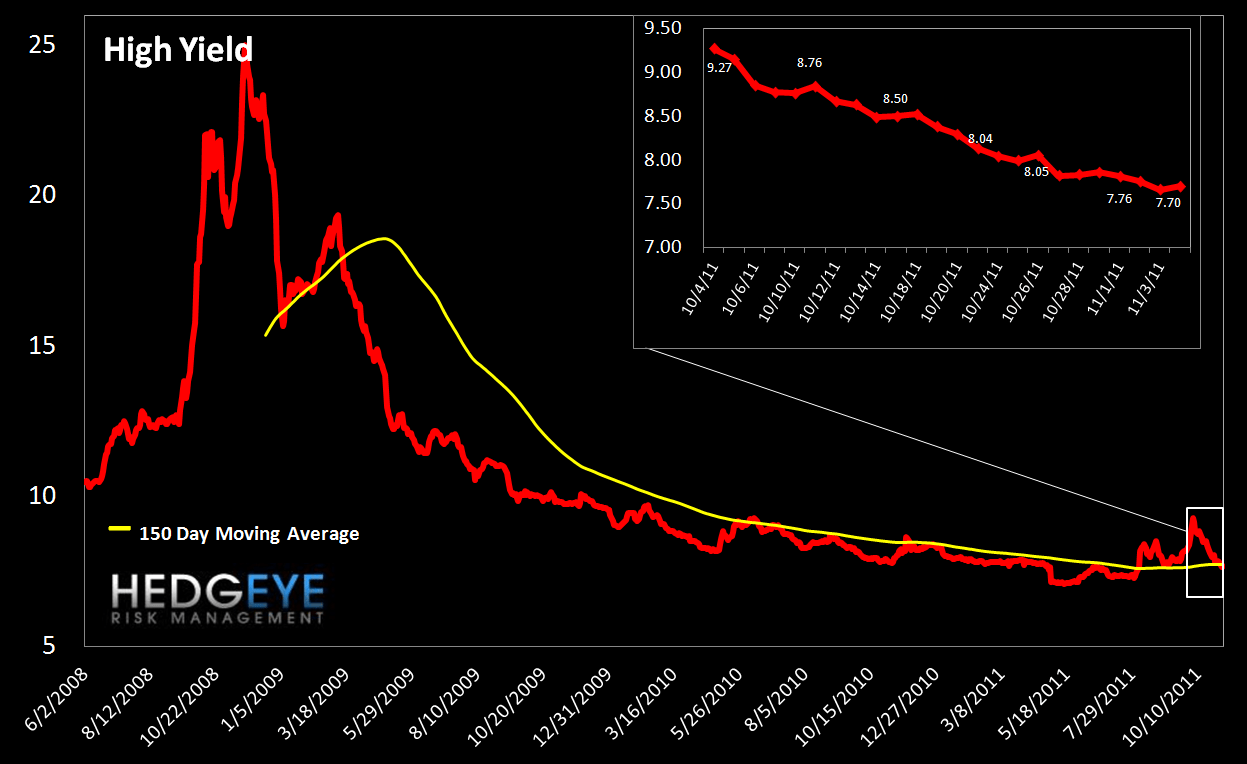
4. High Yield (YTM) Monitor – High Yield rates fell 13 bps last week, ending the week at 7.70 versus 7.83 the prior week.
5. Leveraged Loan Index Monitor – The Leveraged Loan Index fell 4 points last week, ending at 1591.

6. TED Spread Monitor – Early last week, the TED spread hit another new YTD high of 44.5. It retreated slightly off of this level, ending the week at 44.3 bps.

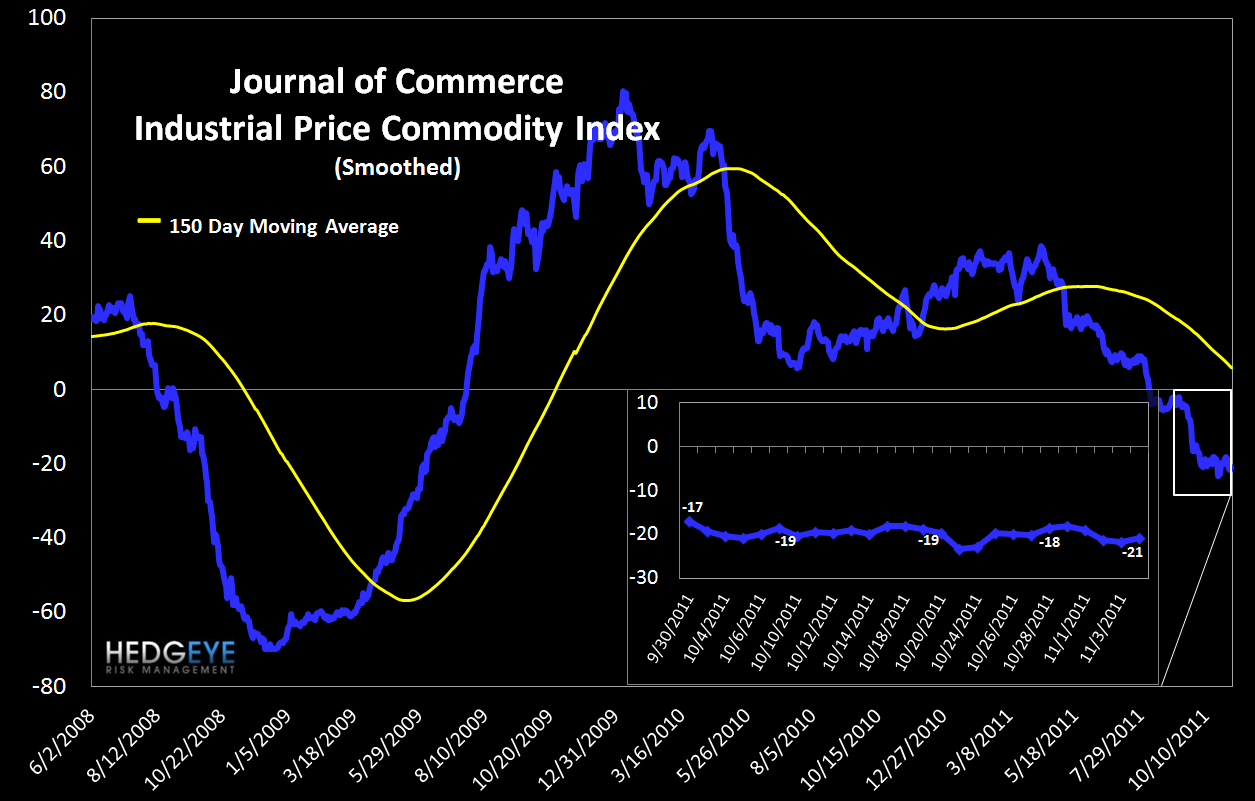
7. Journal of Commerce Commodity Price Index – The JOC index fell 2.3 points, ending the week at -20.8 versus -18.5 the prior week.
8. Greek Yield Monitor – The 10-year yield on Greek debt rose 353 bps last week, ending the week at 2677 bps, a new all-time high.

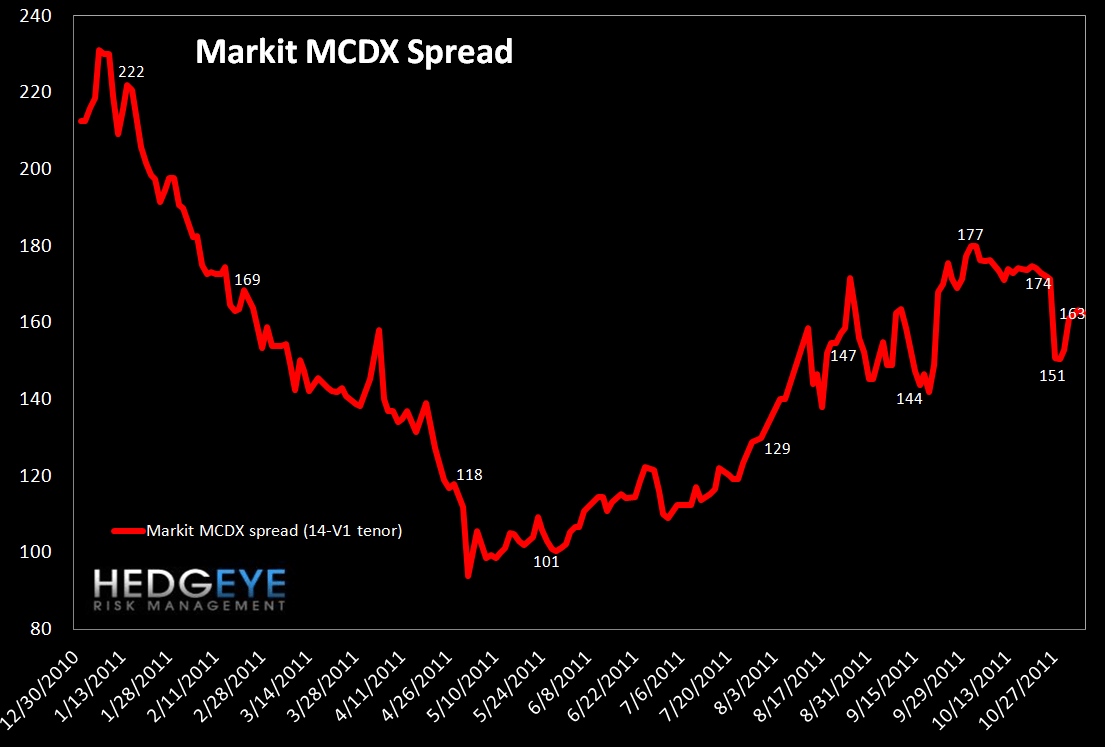
9. Markit MCDX Index Monitor – The Markit MCDX is a measure of municipal credit default swaps. We believe this index is a useful indicator of pressure in state and local governments. Markit publishes index values daily on six 5-year tenor baskets including 50 reference entities each. Each basket includes a diversified pool of revenue and GO bonds from a broad array of states. We track the 14-V1. Last week spreads widened, ending the week at 163 bps versus 151 bps the prior week.
10. Baltic Dry Index – The Baltic Dry Index measures international shipping rates of dry bulk cargo, mostly commodities used for industrial production. Higher demand for such goods, as manifested in higher shipping rates, indicates economic expansion. Last week the index fell 234 points, ending the week at 1784 versus 2018 the prior week.

11. 2-10 Spread – We track the 2-10 spread as an indicator of bank margin pressure. Last week the 10-year yield fell to 2.04, pushing the 2-10 spread to 181 bps, 22 bps tighter than a week ago.

12. XLF Macro Quantitative Setup – Our Macro team’s quantitative setup in the XLF shows 0.9% upside to TRADE resistance and 1.8% downside to TRADE support.

Margin Debt Falls in September
We publish NYSE Margin Debt every month when it’s released.
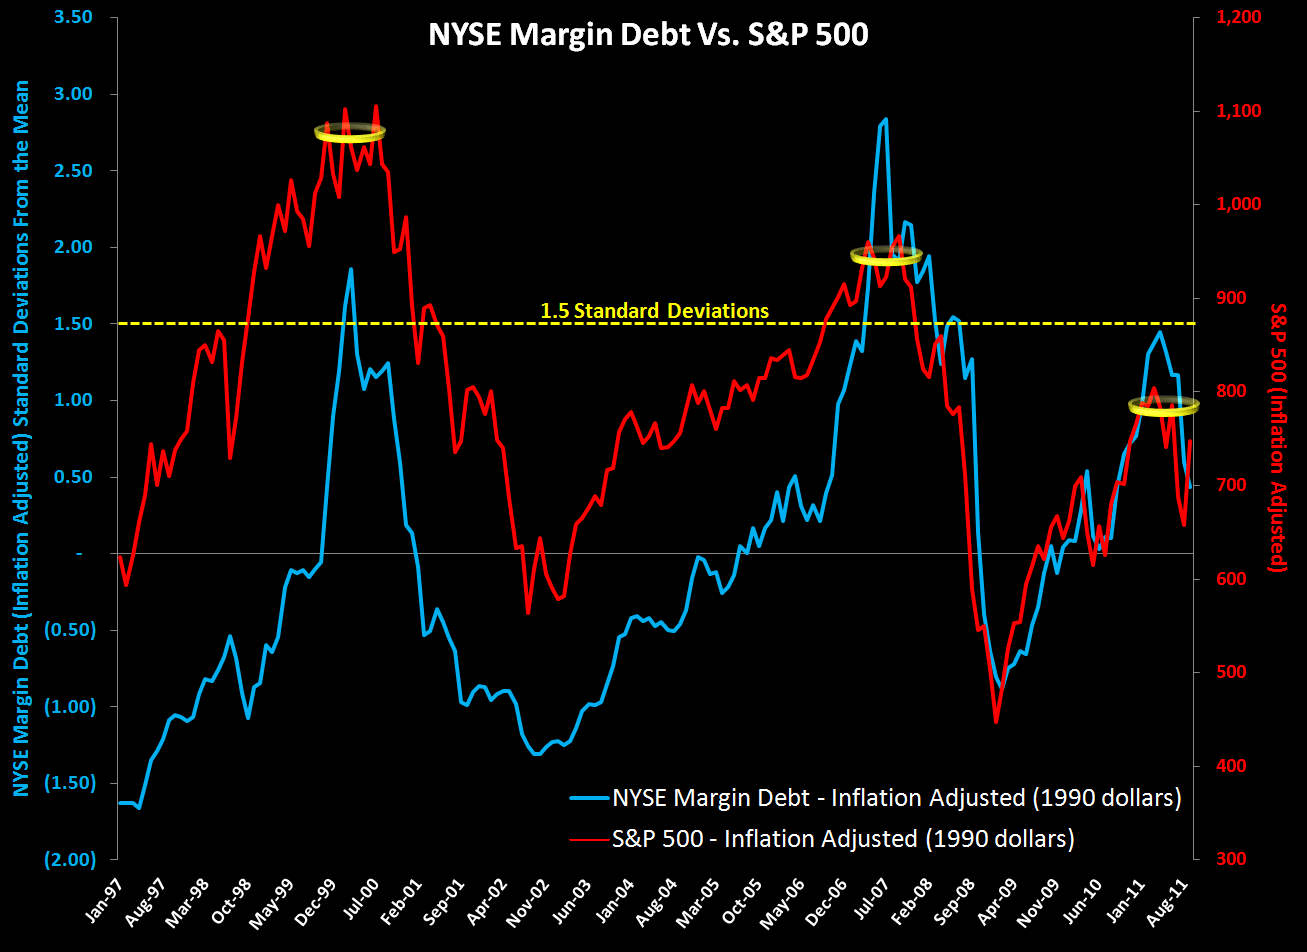
NYSE Margin debt hit its post-2007 peak in April of this year at $320.7 billion. The chart below shows the S&P 500 overlaid against NYSE margin debt going back to 1997. In this chart both the S&P 500 and margin debt have been inflation adjusted (back to 1990 dollar levels), and we’re showing margin debt levels in standard deviations relative to the mean covering the period 1. While this may sound complicated, the message is really quite simple. First, when margin debt gets to 1.5 standard deviations or greater, as it did this past April, that has historically been a signal of extreme risk in the equity market - the last two times it did this the equity market lost half its value in the ensuing period. We flagged this for the first time back in May of this year. The second point is that margin debt trends tend to exhibit high degrees of autocorrelation. In other words, the last few months’ change in margin debt is the best predictor of the change we’ll see in the next few months. This is important because it means that margin debt, which has retraced back to +0.43 standard deviations as of September, still has a long way to go. We would need to see it approach -0.5 to -1.0 standard deviations before the trend reversed. There’s plenty of room for short/intermediate term reversals within this broader secular move, but overall this setup represents a material headwind for the market.
One limitation of this series is that it is reported on a lag. The chart shows data through September.
Joshua Steiner, CFA
Allison Kaptur
Trouble viewing the charts in this email? Please click the link at the bottom of the note to view in your browser.