Higher hold contributed over 10% of the 42% YoY growth. November GGR should fall significantly MoM.
As previously disclosed, October gross gaming revenues (GGR) increased 42% YoY to $3.35BN. With the detail in hand, we can confirm that while growth was strong, the month got a boost from good hold and an easy hold comparison from last October. Total direct play this month was 6.3% of the market, compared to 7.5% last year. The total market held at 3.05% vs. 2.70% in October 2010. Normalizing for hold, October would have increased 30% YoY. High margin Mass business increased 36%, just slightly lower than the 40-41% growth we’ve seen during the last 4 months.
As we approach the next 3 months of the year we expect YoY growth rates to decelerate, partly due to difficult hold comparisons and trends we are seeing in our sequential monthly projections (see “MACAU: EYE ON NOVEMBER” published on 11/2/11). Hold rates for November 2010 through January 2011 ranged between 3.05% and 3.13%. Normal hold levels would alone shave roughly 10% off YoY growth.
Y-o-Y Table Revenue Observations
Total table revenues grew 43% YoY this month, on top of 50% growth last October. October Mass revs rose 36%; VIP revs grew 45%; and Junket RC rose 30%.
LVS
Table revenues grew 5% only YoY – exhibiting the slowest concessionaire growth in the market, in-line with recent trends. We’ll be keenly watching for a turnaround in November since we’ve heard that LVS has been extending additional junket credit and 2 new junkets are coming online at the Four Seasons this month. Over the last 5 months LVS’s table revenues have grown at 14% while the market has grown 48% - roughly 30% of the market’s pace.
- Sands was down 6% YoY, driven by low hold. The YoY decline was driven by a 15% drop in VIP which was somewhat offset by 12% increase in Mass.
- Junket RC was up 21%
- Sands held poorly in October and had a difficult YoY comp. Adjusted for 14% direct play (15% in 3Q11), hold was about 2.05%, compared with 3.00% hold in October 2010 assuming 15% direct play (in-line with 4Q10).
- Venetian was up 8% YoY, driven by a Mass increase of 28% offset by a 4% drop VIP
- Junket VIP RC fell slightly, down 1%
- Assuming 23% direct play in the quarter (just slightly below the 24% we saw in 3Q11), hold was 2.99% compared to 3.12% hold in October 2010 assuming 19% direct play (in-line with 4Q10)
- Four Seasons grew 17%YoY, driven by an 89% increase in Mass VIP revenues and a small 3% increase in VIP revenue.
- Junket VIP RC increased 10% YoY
- While we believe that the property held low, the comparison was also very easy. Assuming 36% direct play (which is close to the 38% in 3Q11 and implies a 19% sequential increase in average monthly direct play levels), hold was 2.65% in October, compared with a hold rate of 1.82% if we assume 54% direct play in October 2010 (in-line with 4Q10)
WYNN
Wynn table revenues were up 36%, which benefited from an easy hold comparison
- Mass was up 23% and VIP increased 40%
- Junket RC increased 11%
- Assuming 10% of total VIP play was direct (in-line with 3Q11), we estimate that hold was 2.9% compared to 2.3% last year (assuming 11% direct play – in-line with 4Q10)
MPEL
Table revenues grew 49% - equally driven by Mass and VIP
- Altira revenues rose 28% with Mass growth at 18% while VIP grew 29%, helped by an easy hold comparison
- VIP RC increased 14%
- We estimate that hold was 2.9% vs. 2.7% last year (direct play is not material at Altira)
- CoD table revenue was up 62%, driven by 57% growth in Mass and 64% growth in VIP – helped by high hold and an easy comparison
- Junket VIP RC grew 37%
- Assuming a 13% direct play level, hold was 3.4% in October compared to 2.6% last year
SJM
Revs grew 15%
- Mass was up 17% and VIP was up 14%
- Junket RC was up 10%
Galaxy
Table revenues continued its streak of triple-digit gains, +201%; mass soared 340%, while VIP gained 186%
- StarWorld table revenues grew 64% - exhibiting the best growth of any mature property
- Mass grew 56% and VIP grew 65%, helped by high hold and an easy comp
- Junket RC grew 28%
- Hold was high at 3.1% compared to just 2.5% hold last October
- Galaxy Macau's total table revenues were $339MM, 41% higher than September’s
- Mass table revenues rose 29% MoM to $59MM
- VIP table revenue of $280MM, a 43% MoM increase, helped by luck. Hold was 3.4% this month vs. 2.8% in September.
- RC volume of $8.3BN, up 19% MoM
MGM
Table revenue increased 50% YoY, helped by high hold in the quarter
- Mass revenue growth was 9%, while VIP grew 60%
- Junket RC increased 24%
- Assuming a direct play level of 8%, we estimate that hold was 3.6% this month vs. 3.0% in October 2010, also assuming direct play of 8%
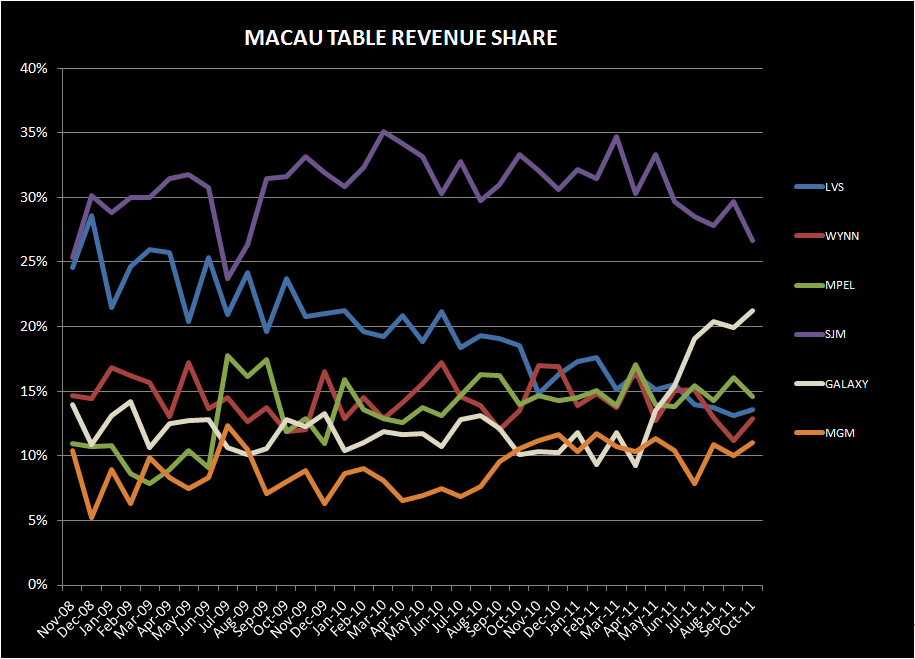
Sequential Market Share (property specific details are for table share while company-wide statistics are calculated on total GGR, including slots)
LVS
Share increased 40bps sequentially to 14.1%. This compares to 6 month trailing market share of 15.1% and 2010 average share of 19.5%
- Sands' share ticked up 10bps to 3.5% off of all time lows in September
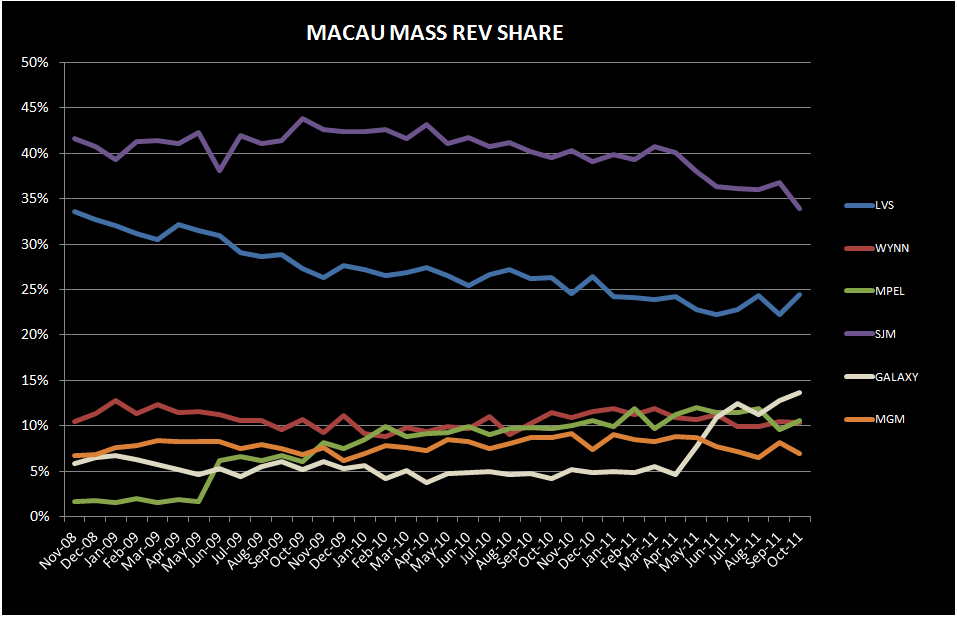
- Mass rev share fell 30 bps offset by a 50bps improvement in VIP share
- Venetian’s share fell 40bps sequentially to 8.1% share
- VIP share fell 1% to 5.9%, below the prior TTM average of 6.8%
- Mass share gained 1.5% sequentially to 15.5% - above the 14% average for the trailing 6 months
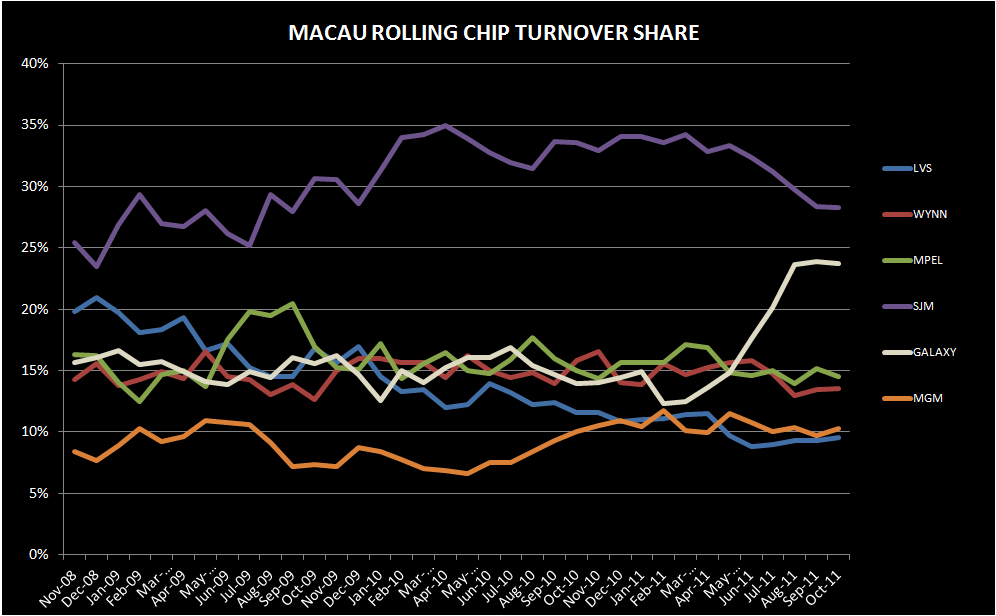
- Junket RC fell 20bps to 4.7%
- FS share improved 80bps to 2.0%
- VIP share increased 1% to 1.9%
- Mass share ticked down 10bps to 2.3%
- Junket RC improved 20bps to 1.5%
WYNN
After hitting an all-time low in September market share, WYNN was the largest share gainer in October – gaining back 1.6% to 13.1% share - although still below their 6 month trailing average share of 14.2% and 2010 average share of 15%. Wynn’s share should continue to struggle with the opening of Sands Cotai Central in March and with the introduction of new junkets at the Four Seasons this month.
- Mass market share fell 20bps at 10.3%
- VIP market share increased 2.2% to 13.6%
- Junket RC share was flat MoM at 13.5%, below its 6 month trailing average of 14.7% and 2010 average of 15.2%
MPEL
Market share fell 1.5% points to 14.7%, below than its average 6 month trailing share of 15.2% but above its 2010 share of 14.6%.
- Altira share fell 50bps to 4.7%, compared to a 5.6% average share in 2010; Mass share fell 10bps while VIP share dropped 1%.
- CoD’s share dropped 80bps to 9.9% driven by share losses in VIP that were partly offset by strength in Mass
- Mass market share increased 1.1% points to 9.1%
- VIP share fell 1.5% points bps to 10.1%
SJM
In a reversal from last month SJM lost the most share in October, down 3.0% to 26.0%, their lowest share since August 2009 and below its 6-month trailing average of 29.2% and 2010 average of 31.3%.
- Mass market share dropped 2.8% to 33.9% - an all-time low
- VIP share fell 2.8% to 24.5%
- Junket RC share ticked down 10bps to 28.3% - their lowest share since Sept 2009
Galaxy
Gained 1.3% share to 20.9%. October share compares with an average share of 10.9% in 2010 and a 6 month trailing average of 16.0%.
- Galaxy Macau share gained 1% to 10.5%
- Mass and VIP market share gained 90bps to 8.2% and 11.2%, respectively
- RC share ticked down 20bps to 10.8%
- Starworld lost 40bps of market share to 9.2%, 10bps above its TTM share of 9.1% pre-Galaxy Macau level.
MGM
Gained 1.1% to 11.2% due to an improvement in VIP share. October share compares with an average share of 10.3% in 2010 and a 6 month trailing average of 10.4%.
- Mass share lost 120bps to 6.9% but was more than offset by a 160bps decrease in VIP share to 12.2%
- Junket RC gained 60bps to 10.3%, above the property’s 2010 average of 8.4% and in-line with its 6 month trailing average of 10.4%
Slot Revenue
Slot revenue grew 18% YoY and increased $2MM sequentially.
- As expected, Galaxy slot revenues grew the most with 309% YoY to a record of $16MM
- MGM slot revenues had the second best growth at 24% YoY to $20MM – an all-time high for the property
- Wynn slot revenues grew 11% YoY to $25MM
- MPEL slot revenues grew 3% YoY to $22MM
- SJM slot revenues grew 7% YoY to $14MM – down from $17MM in September
- LVS slot revenues fell 3% YoY to $33MM