Amid rumors of a widespread European bank recapitalization, CDS tightened for American and European banks last week. The TED spread and High Yield rates hit new YTD highs mid-week underscoring risk in the market.
Financial Risk Monitor Summary (Across 3 Durations):
- Short-term (WoW): Negative / 3 of 11 improved / 4 out of 11 worsened / 4 of 11 unchanged
- Intermediate-term (MoM): Negative / 1 of 11 improved / 6 of 11 worsened / 4 of 11 unchanged
- Long-term (150 DMA): Negative / 1 of 11 improved / 7 of 11 worsened / 3 of 11 unchanged

1. US Financials CDS Monitor – Swaps tightened across 20 of 28 major domestic financials last week.
Tightened the most vs last week: C, MS, TRV
Widened the most vs last week: GS, SLM, AIG
Tightened the most vs last month: PMI, ACE, MMC
Widened the most vs last month: GS, MS, AIG

2. European Financials CDS Monitor – Bank swaps mostly tightened in Europe last week. Swaps tightened for 26 of the 40 reference entities. The average tightening was 2.0%, or 10 basis points, and the median tightening was 3.3%

3. European Sovereign CDS – European sovereign swaps were tighter week over week. German and French sovereign CDS spreads tightened by 15% and 7% respectively from last Monday to today.


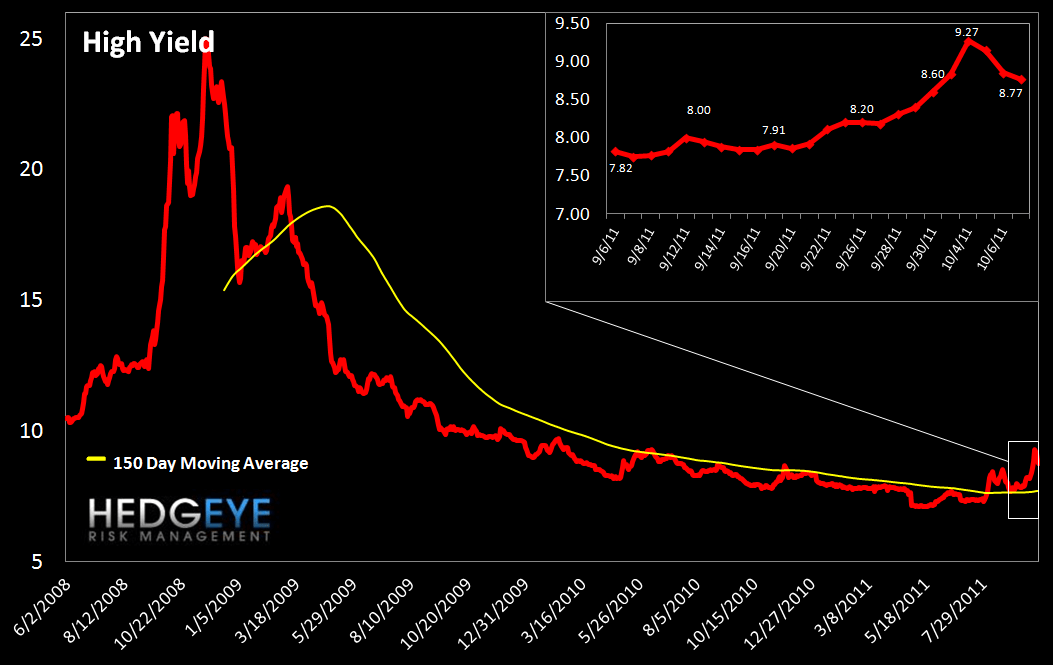
4. High Yield (YTM) Monitor – Last week, High Yield rates rose to a YTD high of 9.27 on Tuesday. Rates retreated throughout the rest of the week but still ended 17 bps higher at 8.77 versus 8.60 the prior week.
5. Leveraged Loan Index Monitor – The Leveraged Loan Index fell 12 points last week, ending at 1515.

6. TED Spread Monitor – The TED spread ended the week just off of its YTD high, 3.2 bps higher than the prior week at 38.6 bps.

7. Journal of Commerce Commodity Price Index – The JOC index continued its decline, falling 1.6 points to end the week at -18.7

8. Greek Yield Monitor – Last week the 10-year yield on Greek debt rose 84 bps to end the week at 2353 bps versus 2269 bps the prior week.

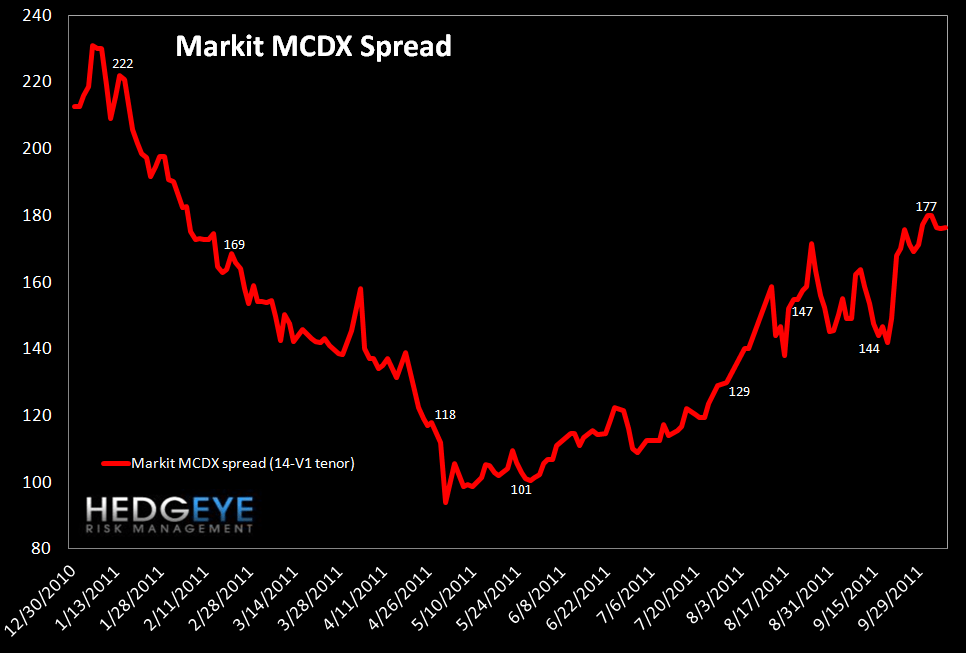
9. Markit MCDX Index Monitor – The Markit MCDX is a measure of municipal credit default swaps. We believe this index is a useful indicator of pressure in state and local governments. Markit publishes index values daily on six 5-year tenor baskets including 50 reference entities each. Each basket includes a diversified pool of revenue and GO bonds from a broad array of states. We track the 14-V1. After bottoming in April, the index has been moving higher. Last week, spreads fell 1 bps and closed at 176 bps.
10. Baltic Dry Index – The Baltic Dry Index measures international shipping rates of dry bulk cargo, mostly commodities used for industrial production. Higher demand for such goods, as manifested in higher shipping rates, indicates economic expansion. Last week the index rose 101 points, ending the week at 2000 versus 1899 the prior week.

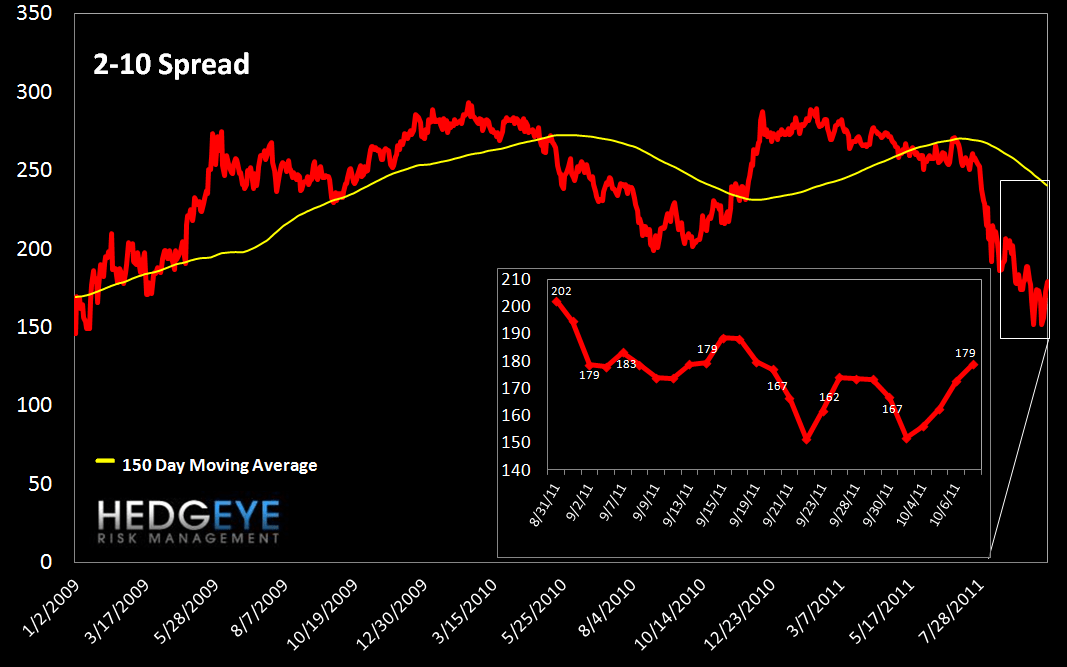
11. 2-10 Spread – We track the 2-10 spread as an indicator of bank margin pressure. Last week the 10-year yield rose to 2.08, pushing the 2-10 spread to 179 bps, 12 bps wider than a week ago.
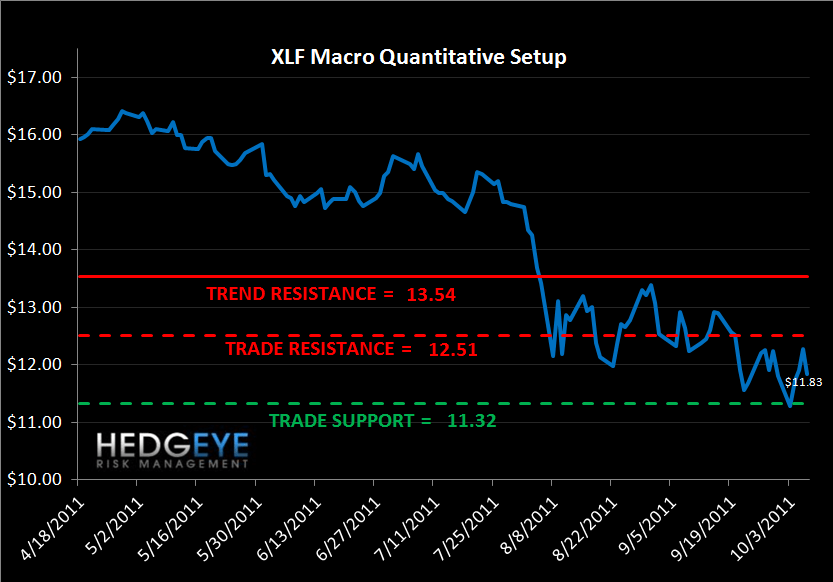
12. XLF Macro Quantitative Setup – Our Macro team’s quantitative setup in the XLF shows the following: 5.7% upside to TRADE resistance, 4.3% downside to TRADE support.
Margin Debt Falls in August
We publish NYSE Margin Debt every month when it’s released. NYSE Margin debt hit its post-2007 peak in April of this year at $320.7 billion. The chart below shows the S&P 500 overlaid against NYSE margin debt going back to 1997. In this chart both the S&P 500 and margin debt have been inflation adjusted (back to 1990 dollar levels), and we’re showing margin debt levels in standard deviations relative to the mean covering the period 1. While this may sound complicated, the message is really quite simple. First, when margin debt gets to 1.5 standard deviations or greater, as it did this past April, that has historically been a signal of extreme risk in the equity market - the last two times it did this the equity market lost half its value in the ensuing period. We flagged this for the first time back in May of this year.
The second point is that margin debt trends tend to exhibit high degrees of autocorrelation. In other words, the last few months’ change in margin debt is the best predictor of the change we’ll see in the next few months. This is important because it means that margin debt, which has retraced back to +0.64 standard deviations as of August, still has a long way to go. We would need to see it approach -0.5 to -1.0 standard deviations before the trend reversed. We’ve dropped 230 S&P handles in getting from +1.5 standard deviations to +0.64 standard deviations. There’s plenty of room for short/intermediate term reversals within this broader secular move, but overall this setup represents a material headwind for the market.
One limitation of this series is that it is reported on a lag. The chart shows data through August.

Joshua Steiner, CFA
Allison Kaptur
