The European crisis dominates the Risk Monitor changes this week. Sovereign CDS put in one of their worst weeks ever, and bank CDS on both sides of the Atlantic reflected the deterioration. The TED spread hit a new high for the YTD and the 2-10 spread continued to tighten. In all, there is little good news in today's risk monitor.
Financial Risk Monitor Summary (Across 3 Durations):
- Short-term (WoW): Positive / 1 of 11 improved / 7 out of 11 worsened / 3 of 11 unchanged
- Intermediate-term (MoM): Negative / 3 of 11 improved / 7 of 11 worsened / 1 of 11 unchanged
- Long-term (150 DMA): Negative / 2 of 11 improved / 7 of 11 worsened / 2 of 11 unchanged
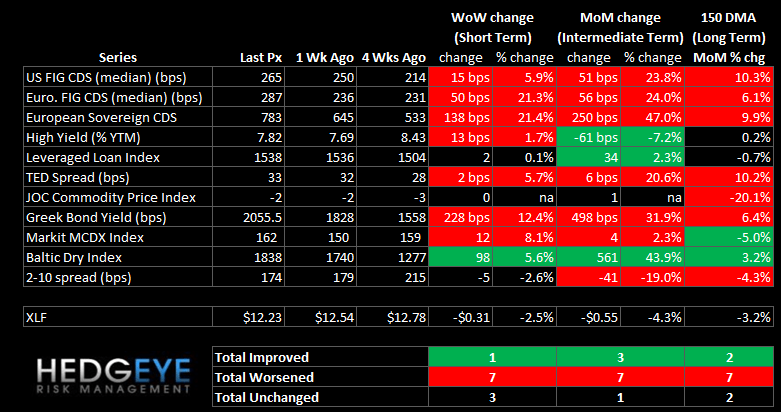
1. US Financials CDS Monitor – Swaps widened in 27 out of 28 major domestic financials in our table last week.
Widened the most vs last week: C, GS, AGO
Tightened the most vs last week: PMI, AON, MMC
Widened the most vs last month: PRU, LNC, HIG
Tightened the most/widened the least vs last month: XL, GNW, MMC

2. European Financials CDS Monitor – Banks swaps also widened in Europe last week. 35 of the 39 swaps were wider and 4 tightened. The average widening was 5.9%, or 25 bps, and the median widening was 21.3%. Tightening was concentrated in the Greek banks, where swaps are already trading well over 1,000 bps.

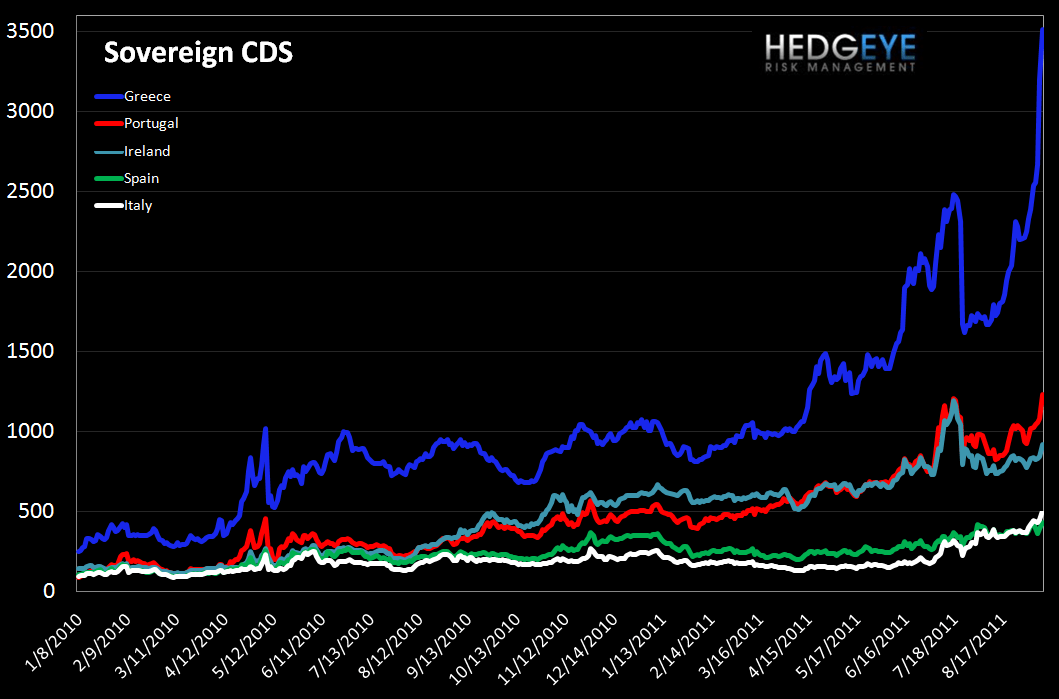
3. European Sovereign CDS – European sovereign swaps went parabolic last week. All the countries we track, with the exception of Ireland, hit a new high as of this morning. Greek swaps are up 56% WoW as of this morning, rocketing to 3500 bps. French CDS rose 23% WoW to a new high of 191 bps.

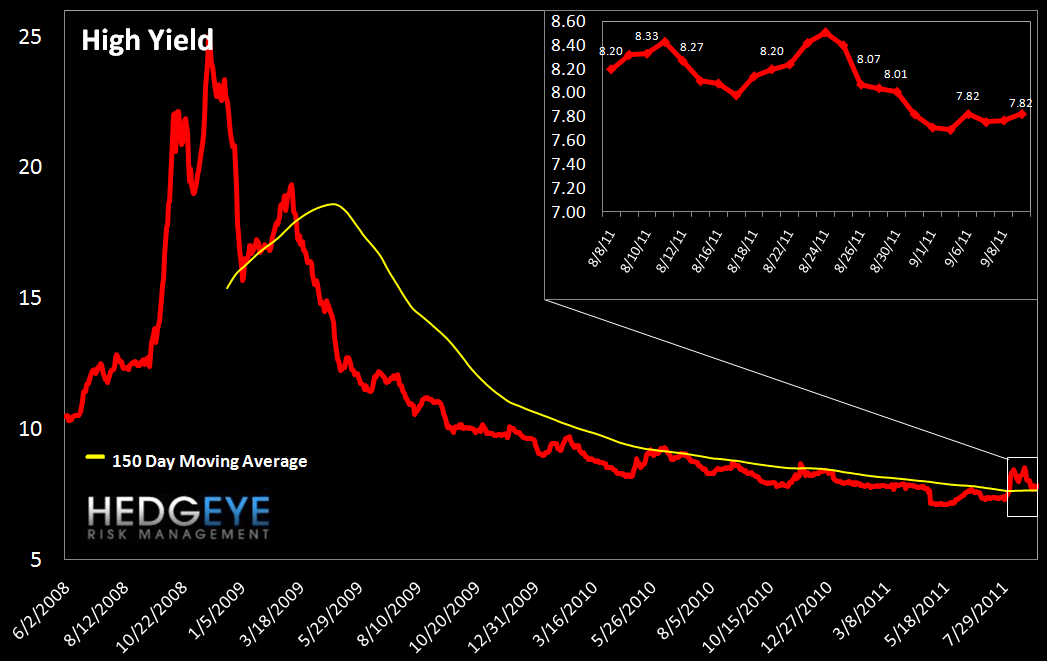
4. High Yield (YTM) Monitor – High Yield rates rose 13 bps last week, ending at 7.82 versus 7.69 the prior week.
5. Leveraged Loan Index Monitor – The Leveraged Loan Index rose 2 points last week, ending at 1538.

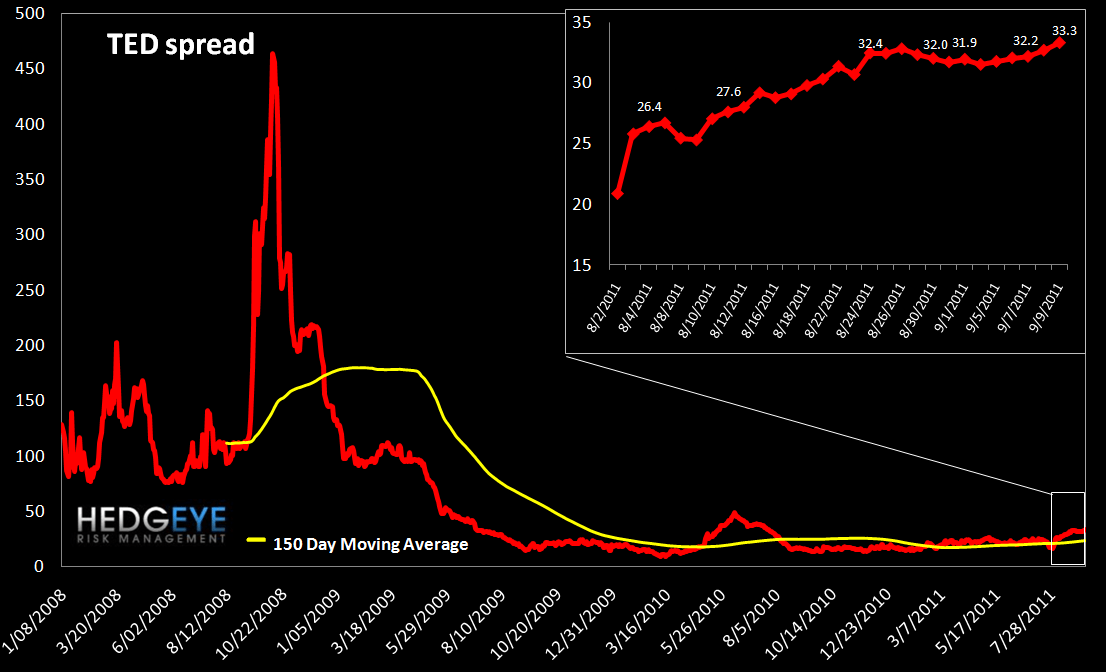
6. TED Spread Monitor – The TED spread made a new YTD high, ending the week at 33.3 versus 31.5 the prior week.
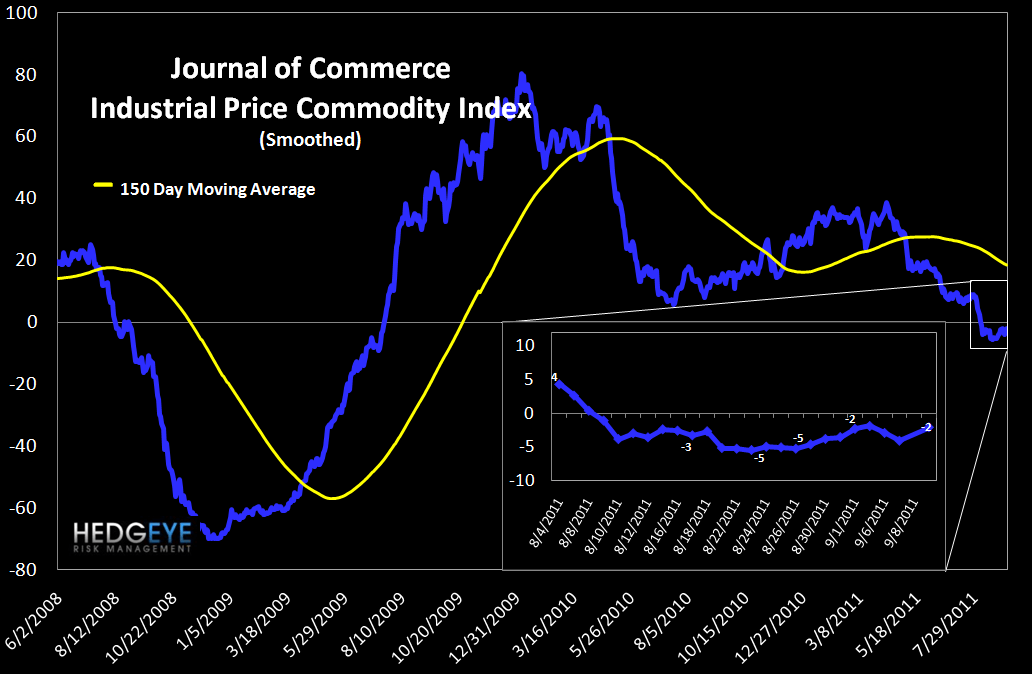
7. Journal of Commerce Commodity Price Index – Last week, the JOC index fell very slightly to -2.1.
8. Greek Bond Yields Monitor – We chart the 10-year yield on Greek bonds. Last week yields hit another new all-time high, ending Friday at 2056.

9. Markit MCDX Index Monitor – The Markit MCDX is a measure of municipal credit default swaps. We believe this index is a useful indicator of pressure in state and local governments. Markit publishes index values daily on six 5-year tenor baskets including 50 reference entities each. Each basket includes a diversified pool of revenue and GO bonds from a broad array of states. We track the 14-V1. After bottoming in April, the index has been moving higher. Last Friday, spreads rose 12 bps and closed at 162 bps.

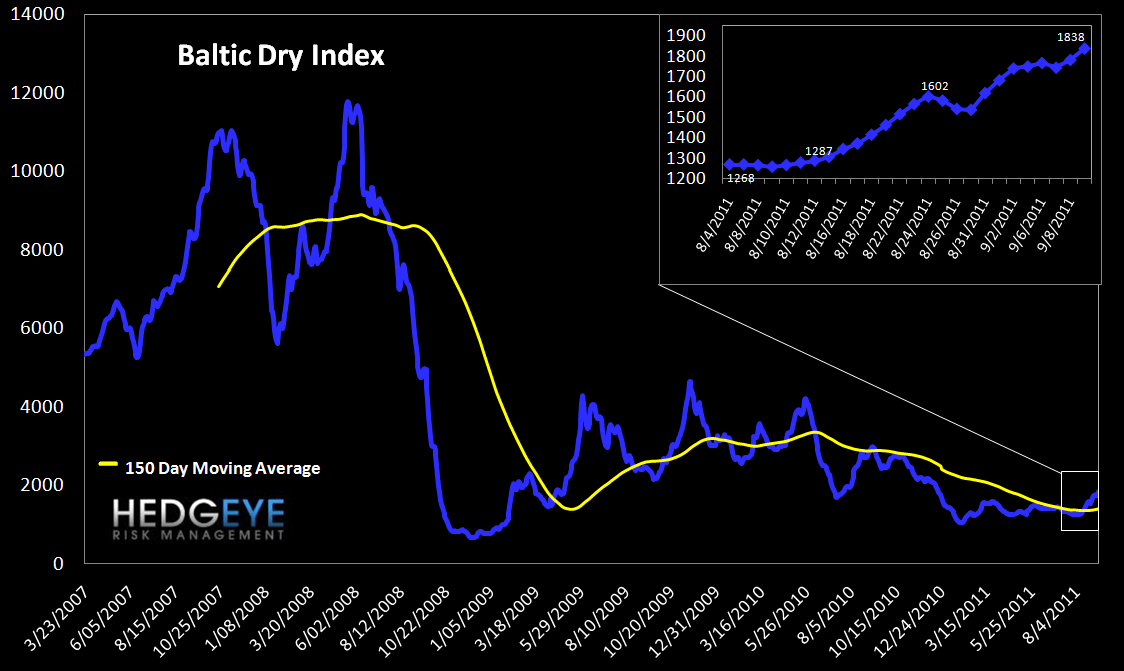
10. Baltic Dry Index – The Baltic Dry Index measures international shipping rates of dry bulk cargo, mostly commodities used for industrial production. Higher demand for such goods, as manifested in higher shipping rates, indicates economic expansion. Last week the index rose sharply off a low level, climbing 98 points to 1838.
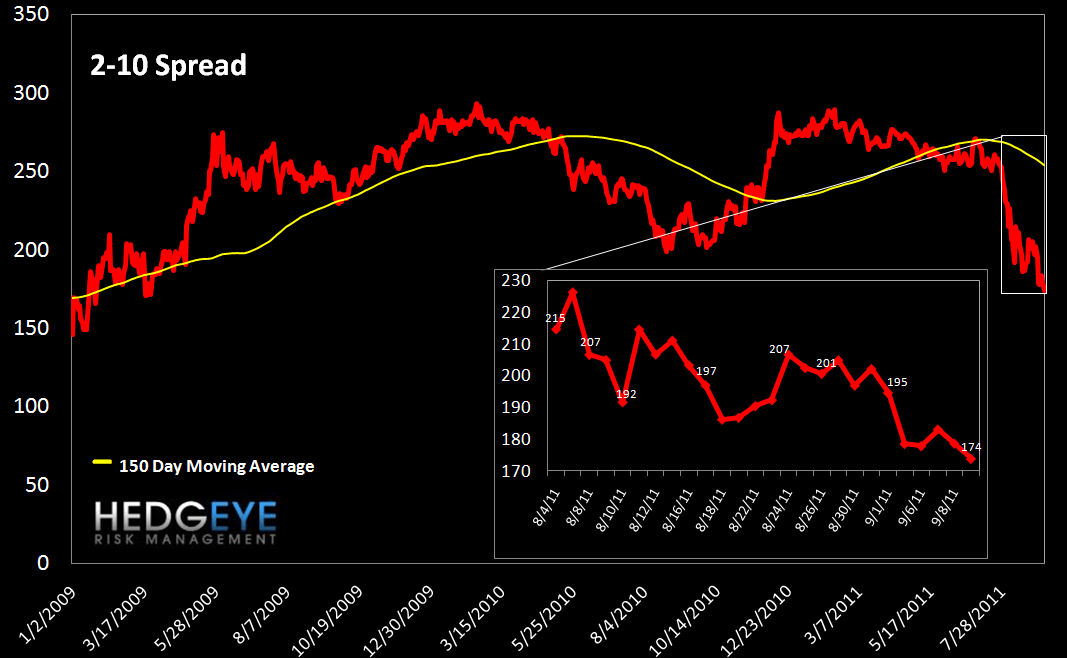
11. 2-10 Spread – We track the 2-10 spread as an indicator of bank margin pressure. Last week the 10-year yield fell 7 bps, pushing the 2-10 spread to 174 bps.
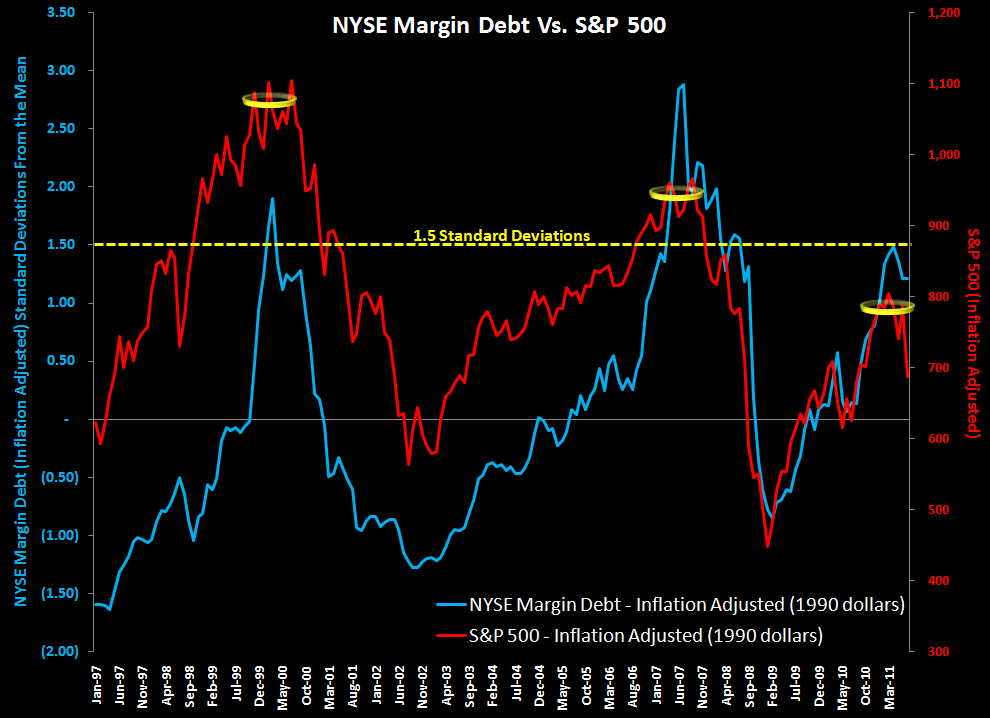
Margin Debt Flat in July
We publish NYSE Margin Debt every month when it’s released. This chart shows the S&P 500, inflation adjusted back to 1997, along with the inflation-adjusted level of margin debt (expressed as standard deviations from the long-run mean). As the chart demonstrates, higher levels of margin debt are associated with increased risk in the equity market. Our analysis shows that more than 1.5 standard deviations above the average level is the point where things start to get dangerous. In July, margin debt held close to flat at $306B. On a standard deviation basis, margin debt fell to 1.21 standard deviations above the long-run average.
One limitation of this series is that it is reported on a lag. The chart shows data through July.
Joshua Steiner, CFA
Allison Kaptur
