The detail was better than the headline
August gross gaming revenues (GGR) increased 57% YoY to $3.1BN. With the detail in hand, we can confirm that this was a terrific month. High margin Mass business increased 41% for the 3rd straight month. Even though VIP hold was higher than last year, VIP volume was the bigger driver, up 58% YoY. It would be hard to poke holes in this month.
We estimate that direct play was 6.1% in July vs. 7.5% last year. Adjusted for direct play volumes, market hold was 2.93% vs. 2.78% last year. If we normalize hold levels, August growth would have been up 51% YoY. September will have a tougher hold comparison and therefore, YoY growth rates should moderate somewhat.
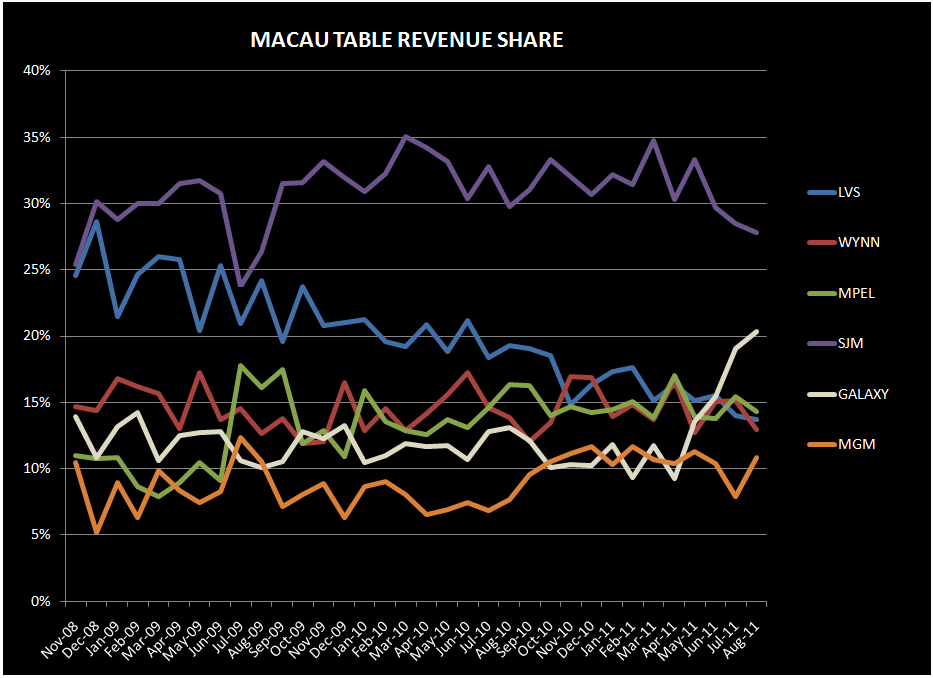
MGM was the largest market gainer in August – helped by an easy July comparison where the company experienced the largest share loss. Galaxy continued to ramp while Wynn lost the most share. VIP growth – or the lack thereof – continued to plague LVS with VIP revenue growing only 5% YoY compared to market growth of 64%. Due to LVS’s continued struggle to attract more junkets, their share hit an all-time low of just 14.2%.
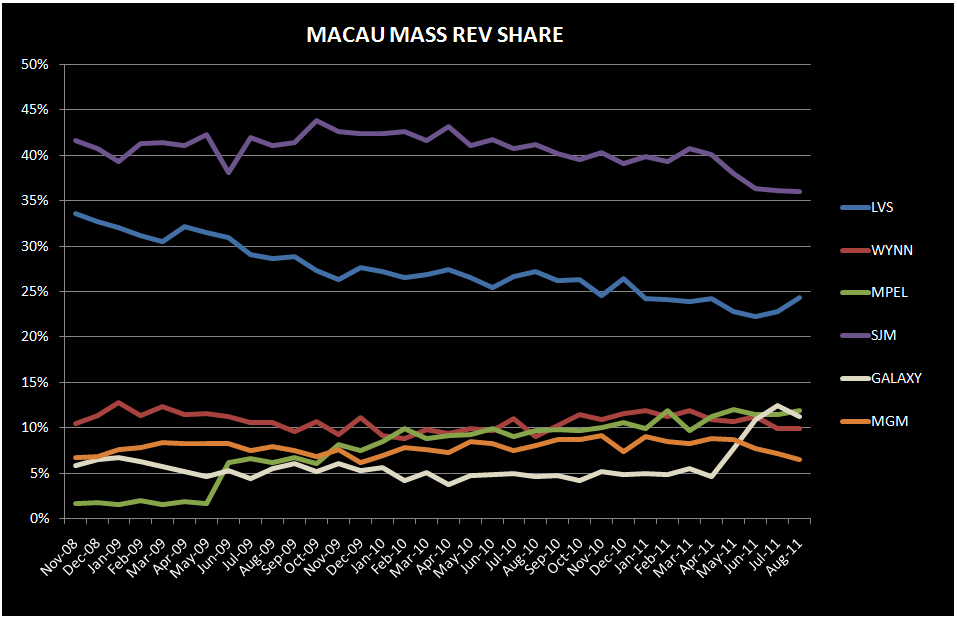
Just looking at Mass, MPEL had the strongest YoY growth (excluding Galaxy of course). Importantly, MPEL gained share in the Mass business which puts them on track to best our EBITDA estimate for Q3 - already 20% above the Street. Wynn and LVS also had good quarters on the Mass front. However, both Wynn and LVS saw slot revenues that were flattish and down YoY, respectively, perhaps indicating saturation in that business.
Y-o-Y Table Revenue Observations
Total table revenues grew 58% YoY this month, on top of 40% growth last August. August Mass revs rose 41%; VIP revs grew 64%; and Junket RC rose 58%.
For the 6th straight month, LVS table revenues grew the slowest – at 12%. Over the 13 months, LVS’s table revenues have grown at roughly 1/3 of the market’s pace.
- Sands was up 37% YoY, driven by a 54% rise in VIP and 13% increase in Mass
- Junket RC was up 27%
- Sands held high in August. Adjusted for 12% direct play (in-line with 2Q11), hold was about 3.47%, compared with 2.85% hold in August 2010 assuming 14% direct play (in-line with 3Q10).
- Venetian was the only property we track to be down YoY in August – with table revenue down 5% YoY. Mass rose 31%, but VIP revenues plunged 25% impacted by low hold and below average Junket RC growth
- Junket VIP RC grew 19%
- Hold in August was 2.3%, based on 21% direct play vs. 3.4% in August 2010 assuming 23% direct play levels.
- Four Seasons was up 42% YoY, driven by 42% growth in Mass and VIP revenues.
- Junket VIP RC grew 14% YoY – the slowest grower in the market
- Results would have been better if not for low hold, however, last Augusts’ hold’s was even worse. Assuming 41% direct play (in-line with 2Q11), we estimate hold was 2.1% compared to 1.6% in August 2010 assuming the same direct play percentage.
Wynn table revenues were up 48%
- Mass was up 53% and VIP increased 47%
- Junket RC increased 38%
- Assuming 8% of total VIP play was direct (in-line with 2Q11), we estimate that hold was 3.1% compared to 2.8% last year (assuming 13% direct play – in-line with 3Q10)
MPEL table revenues grew 39%, driven by Mass growth of 72% and VIP growth of 32%
- Altira revenues rose 44% with Mass up 58% while VIP grew 43%, benefiting from high hold and easy comparisons
- VIP RC increased 15%
- We estimate that hold was 3.1% vs. 2.5% last year
- CoD table revenue was up 36%, driven by 75% growth in Mass and 26% growth in VIP
- Junket VIP RC grew 33%
- Assuming a 13% direct play level, hold was 3.0% in August compared to 3.1% last year
SJM revs grew 48%
- Mass was up 23% and VIP was up 61%
- Junket RC was up 50%
Galaxy table revenue skyrocketed 146%. Mass soared 240% and VIP rose by 136%.
- StarWorld table revenues grew 42%
- Mass grew 40% and VIP grew 42%
- Junket RC grew 40.5%
- Hold was high at 3.1% but flat YoY
- Galaxy Macau's total table revenues were $278MM, 18% higher than July and 74% higher than June’s first full month of operations
- Mass table revenues fell slightly MoM to $43MM from $45MM in July
- VIP table revenue of $235MM, increased 23% MoM with RC volume of $7.9BN. Assuming 4% direct play, hold was 3%.
MGM table revenue soared 125%, boosted by healthy RC volumes, high hold and easy comps.
- Mass revenue growth was 15%, while VIP ballooned 166%
- Junket RC grew 96%
- Assuming a direct play level of 8%, we estimate that hold was 3.4% this month vs. 2.5% in August 2010 assuming direct play of 9%
Sequential Market Share (property specific details are for table share while company-wide statistics are calculated on total GGR, including slots)
LVS share in July fell 30bps sequentially to 14.2% - an all-time low for LVS. This compares to 6 month trailing market share of 16.1% and 2010 average share of 19.5%
- Sands' share increased 1% to 5%,
- The increase in share was primarily attributed to a 120bps increase in VIP rev share
- Venetian’s share dropped 20bps to 7.0% share, an all-time low since opening
- VIP share fell 70bps to 4.5%, also setting a record low for the property
- On the bright side, Mass share increased 90bps to 15% - above the 14% average for the trailing 6 months
- Junket RC remained flat at 4.6%
- FS share fell 1% to 1.7%
- VIP share dropped 1.4% to 1.6%
- Mass share increased 40bps to 2.2%
- Junket RC increased to 1.4% - up 40 bps sequentially
WYNN lost the most share in August with a 2% drop to just 13.2%. Augusts’ share was below its 6 month trailing average share of 15% and 2010 average share of 15%.
- Mass market share was held flat at 9.9%
- VIP market share plummeted 2.8% to 13.9%
- Junket RC share fell 1.8% to 12.9%, below its 6 month trailing average of 15.3% and 2010 average of 15.2%
MPEL market share fell 1.1% to 14.5%, below their average 6 month trailing share of 15% and 2010 share of 14.6%.
- Altira share fell 1% to 5.1%, compared to a 5.6% average share in 2010
- CoD’s share ticked down 10 bps sequentially to 9.2%
- Mass market share declined 10bps to 10% - still second only to Venetian and slightly ahead of Wynn’s share
- VIP share fell 10 bps to 9.0%
SJM share fell 60bps to 27.2% in August- the lowest share since August 2009 and below its 6-month trailing average of 30.6% and 2010 average of 31.3%.
- Mass market share remained flat at 36.1%
- VIP share fell 1% to 25.3%
- Junket RC share fell 40bps to 29.8%
Galaxy continued its momentum from Galaxy Macau, gaining 1.3% share to 20.1%, its highest share since August 2007. August share compares with an average share of 10.9% in 2010 and a 6 month trailing average of 12.8%.
- Galaxy Macau garnered 9.4% market share, up from 8.1% in July
- Mass market share fell 70bps to 6.3%, offset by a VIP share gain of 180bps to 10.3% and RC share gained 240bps to 10.8%.
- This marked the 4th straight month of post-GM opening that Starworld continued to gain share - increasing 30bps to a market share to 9.7%, 60 bps above its TTM pre-Galaxy Macau level.
- Mass market share ticked down 10bps to 2.8% while VIP share rose 170bps to 11.4%
Even in the face of the GM ramp, MGM was the largest share gainer in August – granted this follows a month where MGM lost the most share. MGM’s share increased 2.8% to 10.9%. August share compares with an average share of 8.8% in 2010 and a 6 month trailing average of 10.6%.
- Mass share declined 60bps to 6.5% but was more than offset by a 4% increase in VIP share to 12.1%
- Junket RC increased 40bps to 10.4%, materially above the property’s 2010 average of 8.4% but below its 6 month trailing average of 10.7%
Slot Revenue
Slot revenue growth decelerated to 22% YoY in August to $116MM, down 4% sequentially
- Galaxy slot revenues grew 601% YoY, reaching $15MM due to GM
- MGM had the second best growth at 35% YoY, but decreasing $1MM sequentially to $15MM
- SJM’s slot revenues grew 20% YoY to $14MM
- MPEL’s slot revenue grew 16% YoY to $21MM
- Wynn’s slot revenue only grew 1% YoY to $21MM
- LVS slot revenues actually fell 3% YoY to $30MM