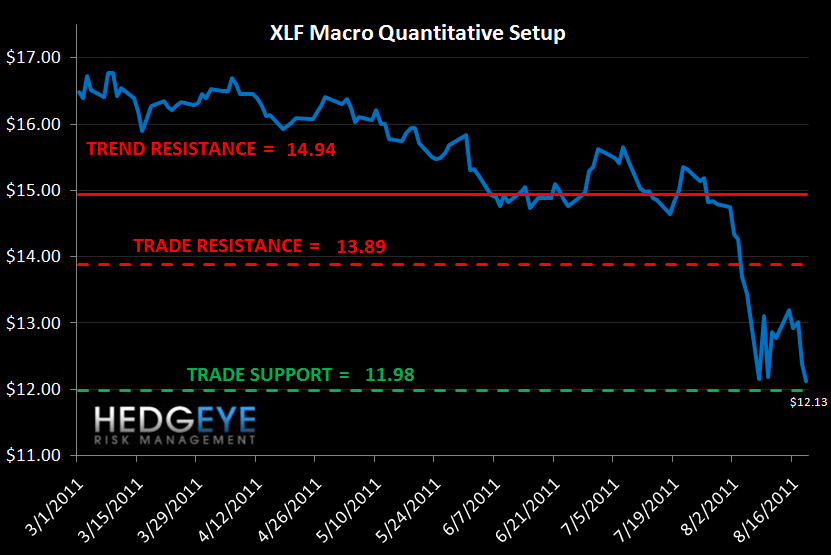
This week's notable callouts include a new YTD high in the TED spread and continuing widening of US and European financial CDS. Our Macro team's quantitative levels for the XLF show a high probability of a squeeze in the XLF (23% upside to TRADE resistance, 1.2% downside to TRADE support) before the bear market trend takes hold once again.
Financial Risk Monitor Summary (Across 3 Durations):
- Short-term (WoW): Negative / 2 of 11 improved / 6 out of 11 worsened / 3 of 11 unchanged
- Intermediate-term (MoM): Negative / 2 of 11 improved / 8 of 11 worsened / 1 of 11 unchanged
- Long-term (150 DMA): Negative / 1 of 11 improved / 8 of 11 worsened / 2 of 11 unchanged

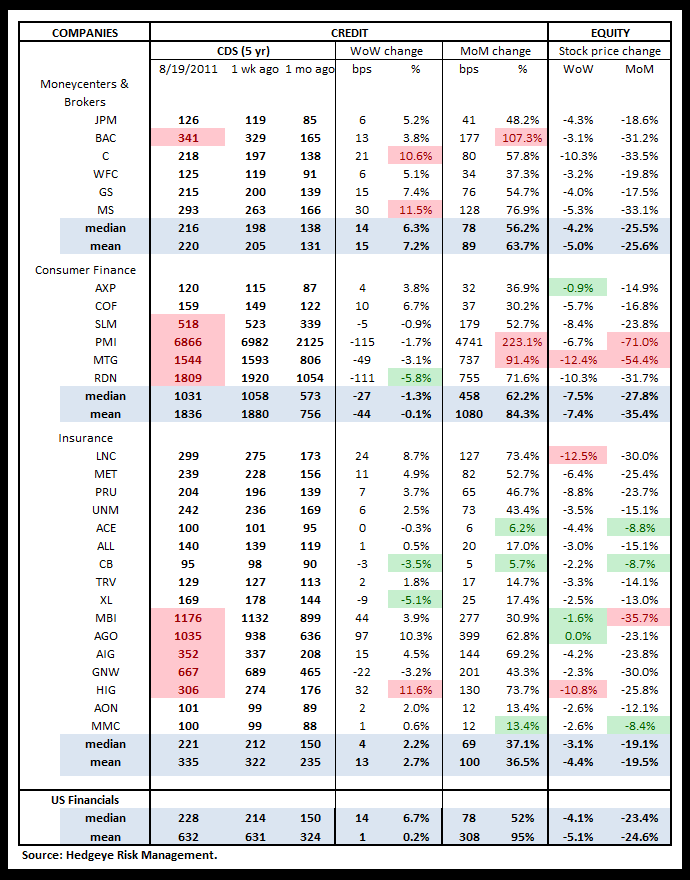
1. US Financials CDS Monitor – Swaps widened across domestic financials last week (20 of 28 issuers widening). On a month-over-month basis, not one issuer was tighter. The largest moves were at BAC, MS and LNC.
Widened the most vs last week: C, MS, HIG
Tightened the most vs last week: RDN, CB, XL
Widened the most vs last month: BAC, PMI, MTG
Widened the least vs last month: ACE, CB, MMC
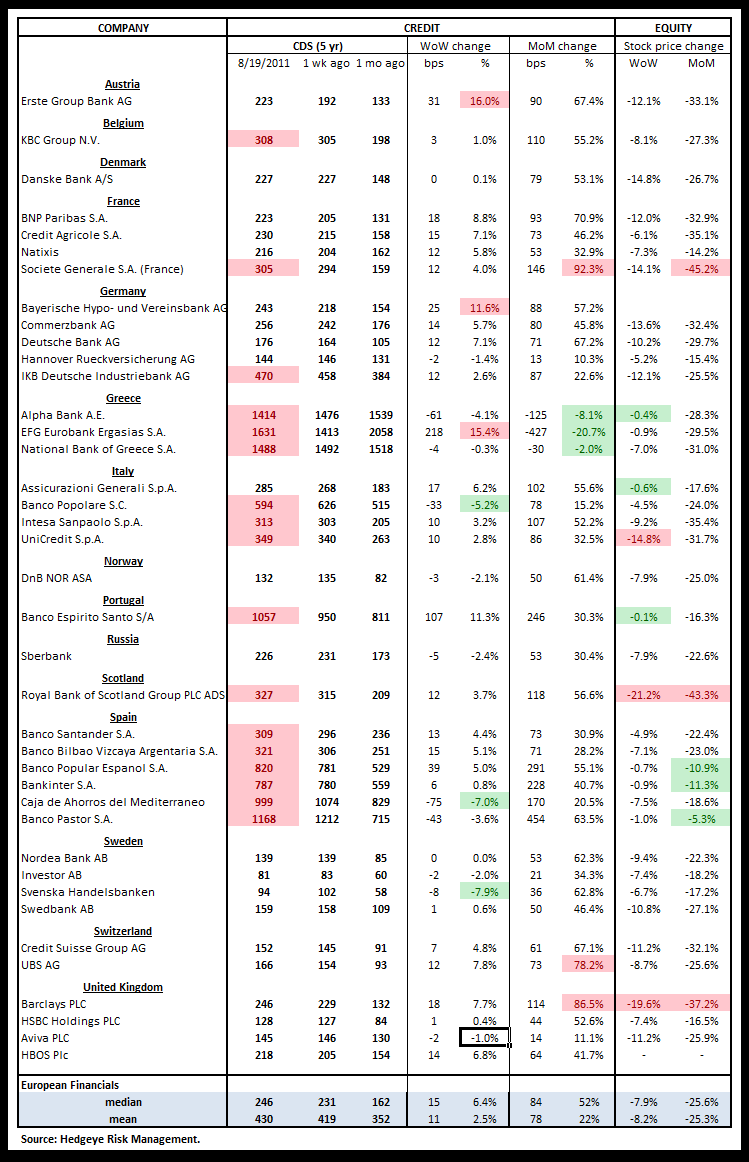
2. European Financials CDS Monitor – Banks swaps in Europe were mostly wider last week. 28 of the 38 swaps were wider and 10 tightened.
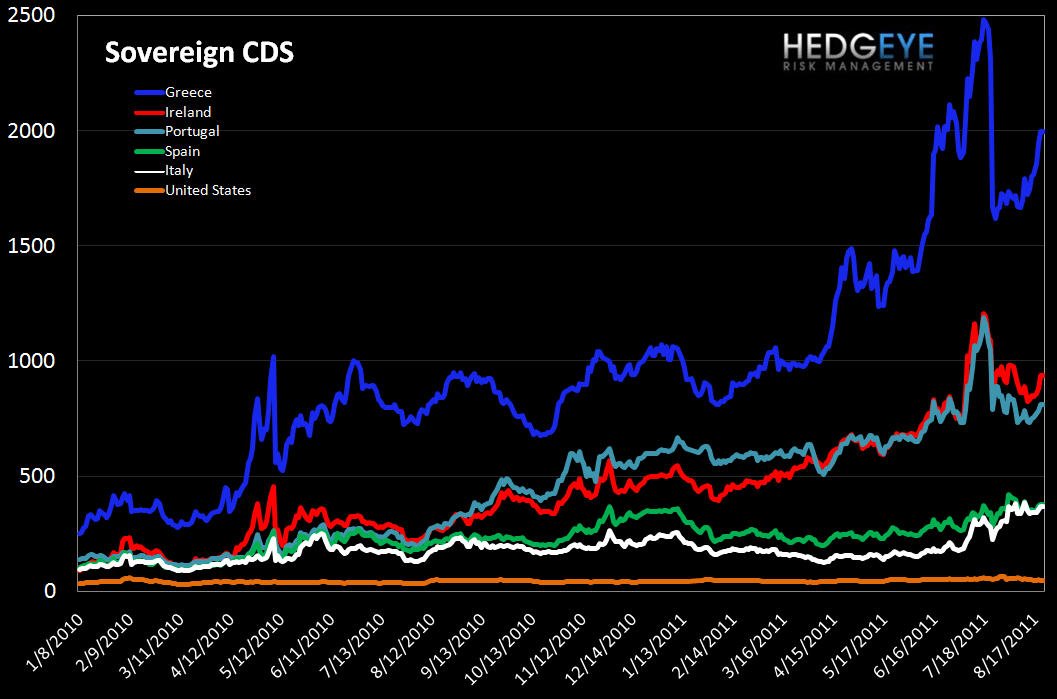
3. European Sovereign CDS – European sovereign swaps were wider week over week across the continent. We are keeping a close eye on France, which is critical to the EFSF, and where swaps widened by 4 bps (to 154 bps) week over week. We believe the CDS market is currently pricing in decreased hedge effectiveness in addition to improvement in sentiment around sovereign solvency. Judging by the Greek bailout, regulators are making a concerted effort to design a bailout that does not trigger CDS.

4. High Yield (YTM) Monitor – High Yield rates fell last week, ending at 8.20 versus 8.27 the prior week.

5. Leveraged Loan Index Monitor – The Leveraged Loan Index rose 5 points last week, ending at 1514.

6. TED Spread Monitor – The TED spread rose to a new YTD high, ending the week at 30.3 versus 28.0 the prior week.

7. Journal of Commerce Commodity Price Index – Last week, the JOC index fell further to –5.2 from -3.6.

8. Greek Bond Yields Monitor – We chart the 10-year yield on Greek bonds. Last week yields rose 110 bps, ending the week at 1664.

9. Markit MCDX Index Monitor – The Markit MCDX is a measure of municipal credit default swaps. We believe this index is a useful indicator of pressure in state and local governments. Markit publishes index values daily on six 5-year tenor baskets including 50 reference entities each. Each basket includes a diversified pool of revenue and GO bonds from a broad array of states. We track the 14-V1. After bottoming in April, the index has been moving higher. Last Friday, spreads closed at 155 bps.

10. Baltic Dry Index – The Baltic Dry Index measures international shipping rates of dry bulk cargo, mostly commodities used for industrial production. Higher demand for such goods, as manifested in higher shipping rates, indicates economic expansion. Last week the index rose sharply off a very low level, climbing 175 points to 1462.

11. 2-10 Spread – We track the 2-10 spread as a proxy for bank margins. Last week the 2-10 spread tightened a further 20 bps to 187 bps.

12. XLF Macro Quantitative Setup – Our Macro team’s quantitative setup in the XLF suggests bias to the upside as follows: 23.2% upside to TRADE resistance, 1.2% downside to TRADE support.
Margin Debt Continues to Fall
We publish NYSE Margin Debt every month when it’s released. This chart shows the S&P 500, inflation adjusted back to 1997, along with the inflation-adjusted level of margin debt (expressed as standard deviations from the long-run mean). As the chart demonstrates, higher levels of margin debt are associated with increased risk in the equity market. Our analysis shows that more than 1.5 standard deviations above the average level is the point where things start to get dangerous. In May, margin debt decreased $9.5B to $306B. On a standard deviation basis, margin debt fell to 1.21 standard deviations above the long-run average.
One limitation of this series is that it is reported on a lag. The chart shows data through June.

Joshua Steiner, CFA
Allison Kaptur