Peak market growth or seasonality?
The numbers are in for the Singapore casino gaming market in Q2 and it ain’t pretty. For a quarter-on-quarter comparison in Q2, Gross Gaming Revenues fell 5.6% to S$1.8BN, (5.4% on a net basis), EBITDA dropped 5.2% to S$855MM, mass revenues slipped 0.3% to S$584MM and VIP Rolling Chip Volume was 0.6% lower to S$31.6BN. The decelerating growth in Singapore could be a sign of a maturing market or is it seasonality?
By contrast, Macau GGR grew 12% sequentially in Q2. Moreover, Q3 is on pace to grow another 7% on top of Q2. While Macau and Singapore are two different markets and the opening of Galaxy Macau in mid May did boost growth, we would guess the seasonality profiles of each wouldn’t vary too much. Given the newness of Singapore, one would expect sequential growth to be even higher than Macau. Obviously, that is not happening. We need more quarters to fully assess the seasonality vs peaking growth situation but signs certainly seem to point to a market that has already seen its best growth.
Poor hold of 2.8% in the quarter negatively impacted results, especially compared to 1Q11 which held high at 3.3%. Average hold for the 2 IR’s since 1Q10 has been close to 3%. If we adjust Q2 hold using the average hold rate of 3%, Q2 GGR would have actually increased QoQ but at a slower rate. The chart below shows how the Singapore market would have trended on a hold-adjusted basis. Sequential revenue growth have been falling since 3Q 2010.

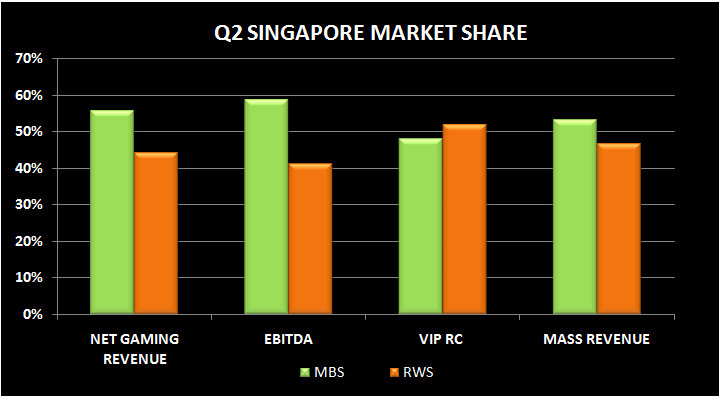
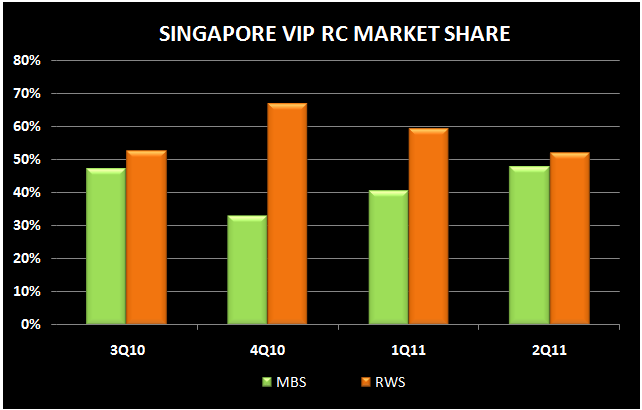
In terms of Q2 market share, MBS, helped by higher hold and higher mix of non-gaming revenues, became the market leader for the 1st time in terms of net gaming revenue. MBS also wrestled the lead back from RWS in EBITDA and Mass revenue share, and closed the gap with RWS in RC share.
No matter how you slice it though, Singapore slowed in Q2 and the outlook for significant further growth, particularly from the Mass market, remains cloudy. According to Genting, the Mass market is constrained due to an insufficient supply of hotel rooms in Singapore, limited ‘local’ population, and inability to promote gaming to locals. High hotel occupancy rates in Singapore imply that the market is in fact short of room supply. From Jan-May 2011, Singapore hotel occupancy averaged 85%, 1% lower than 2010’s occupancy rate. Therefore, MBS has a clear advantage in that it has twice as many hotel rooms as RWS.
It is still uncertain how 3Q will play out as a seasonally slow August - “Ghost” month - will be offset by a strong September, propelled by Formula One Racing and a strong convention calendar. Nevertheless, we believe growth has peaked in the near-term and wouldn’t be surprised to see unimpressive growth for the rest of the year. Obviously, the wild card is the licensing of the junkets before year-end, which would boost VIP RC volumes.