This week's notable callouts include US and EU financial CDS spiking in conjunction with extraordinary volatility in the market last week.
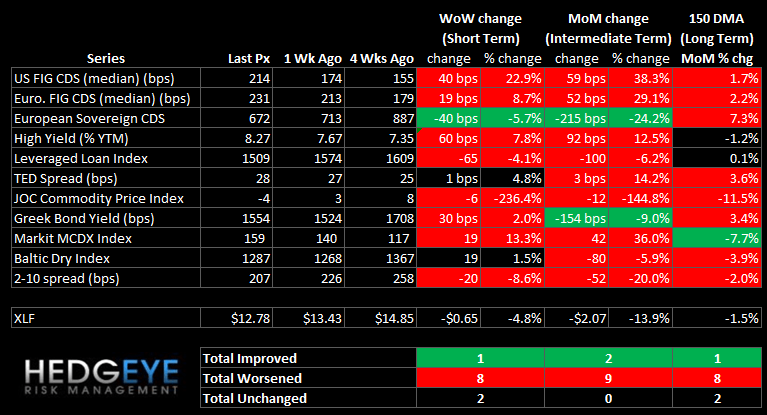
Financial Risk Monitor Summary (Across 3 Durations):
- Short-term (WoW): Negative / 1 of 11 improved / 8 out of 11 worsened / 2 of 11 unchanged
- Intermediate-term (MoM): Negative / 2 of 11 improved / 9 of 11 worsened / 0 of 11 unchanged
- Long-term (150 DMA): Negative / 1 of 11 improved / 8 of 11 worsened / 2 of 11 unchanged
1. US Financials CDS Monitor – Swaps widened across all domestic financials last week (27 of 28 issuers widening). On a month-over-month basis, not one issuer was tighter. The largest moves were at BAC, MS and LNC.
Widened the most vs last week: BAC, MS, LNC
Widened the least vs last week: PMI, ACE, TRV
Widened the most vs last month: PMI, MTG, RDN
Tightened the most/widened the least vs last month: ACE, CB, MMC

2. European Financials CDS Monitor – Banks swaps in Europe were mostly wider last week. 34 of the 38 swaps were wider and 4 tightened.
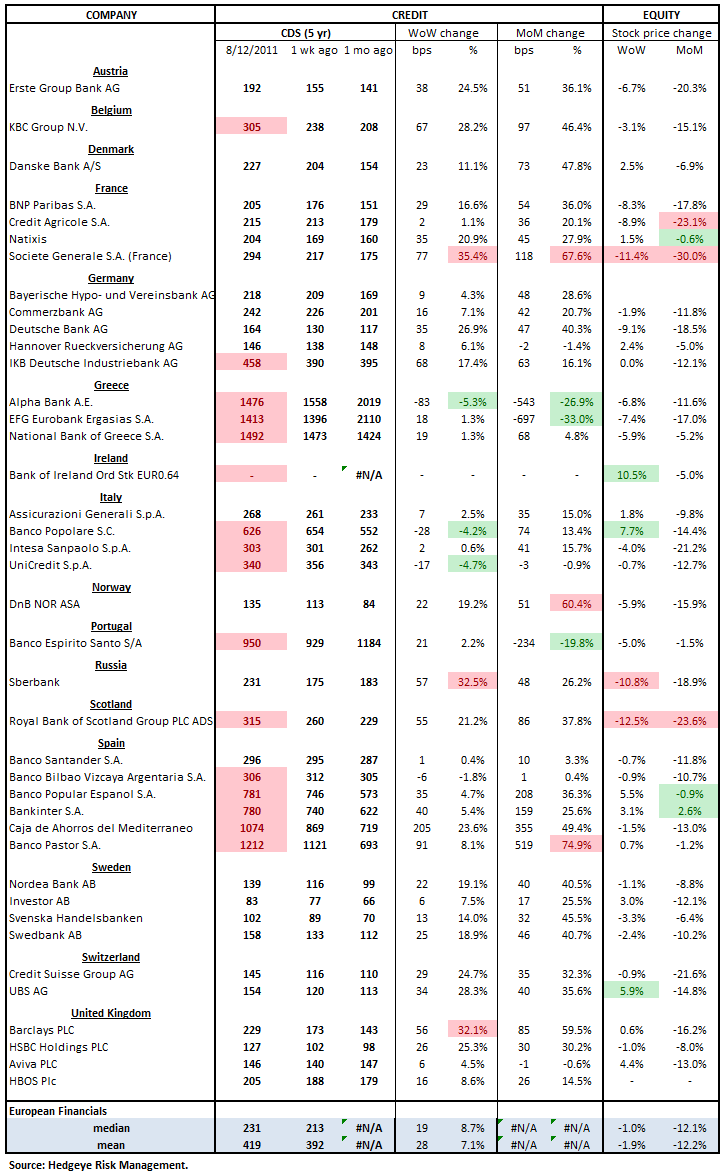
3. European Sovereign CDS – European sovereign swaps were tighter week over week in Spain, Italy, Ireland and Portugal and wider in Greece. For reference, France was wider by 2 bps (to 147 bp) week over week while Germany was wider by 4 bps (to 77 bp). We believe the CDS market is currently pricing in decreased hedge effectiveness in addition to improvement in sentiment around sovereign solvency. Judging by the Greek bailout, regulators are making a concerted effort to design a bailout that does not trigger CDS.

4. High Yield (YTM) Monitor – High Yield rates were up significantly last week, ending at 8.27 versus 7.67 the prior week.

5. Leveraged Loan Index Monitor – The Leveraged Loan Index fell 65 points last week, ending at 1509.

6. TED Spread Monitor – The TED spread rose slightly, ending the week at 28 versus 26.7 the prior week.

7. Journal of Commerce Commodity Price Index – Last week, the JOC index fell further to -3.6 from +2.6.

8. Greek Bond Yields Monitor – We chart the 10-year yield on Greek bonds. Last week yields rose 30 bps, ending the week at 1554.

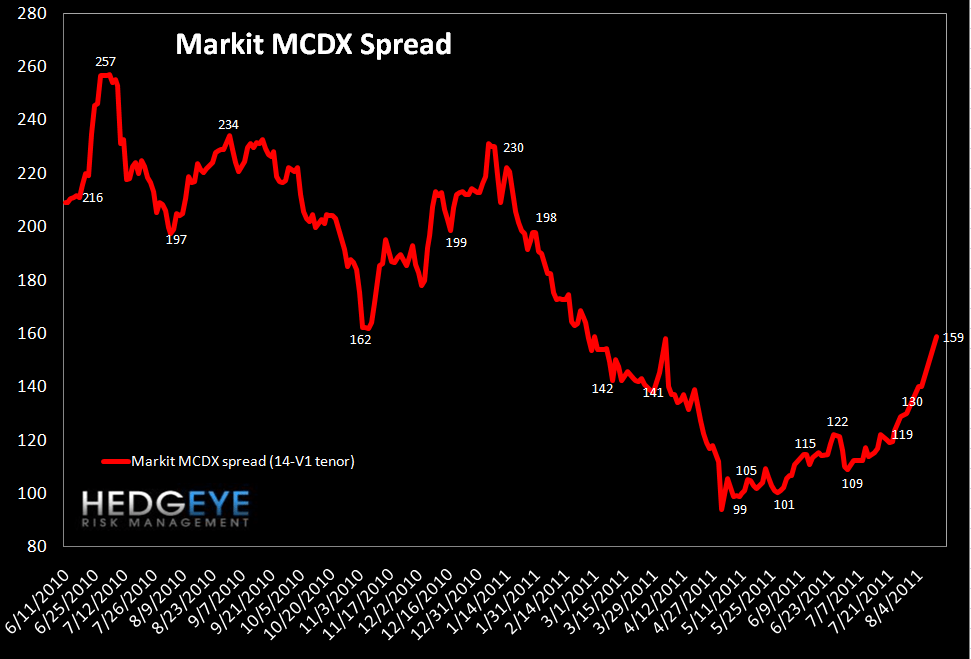
9. Markit MCDX Index Monitor – The Markit MCDX is a measure of municipal credit default swaps. We believe this index is a useful indicator of pressure in state and local governments. Markit publishes index values daily on six 5-year tenor baskets including 50 reference entities each. Each basket includes a diversified pool of revenue and GO bonds from a broad array of states. We track the 14-V1. After bottoming in April, the index has been moving higher. Last Friday, spreads closed at 159 bps.
10. Baltic Dry Index – The Baltic Dry Index measures international shipping rates of dry bulk cargo, mostly commodities used for industrial production. Higher demand for such goods, as manifested in higher shipping rates, indicates economic expansion. Last week the index rose slightly, rising 19 points to 1287.

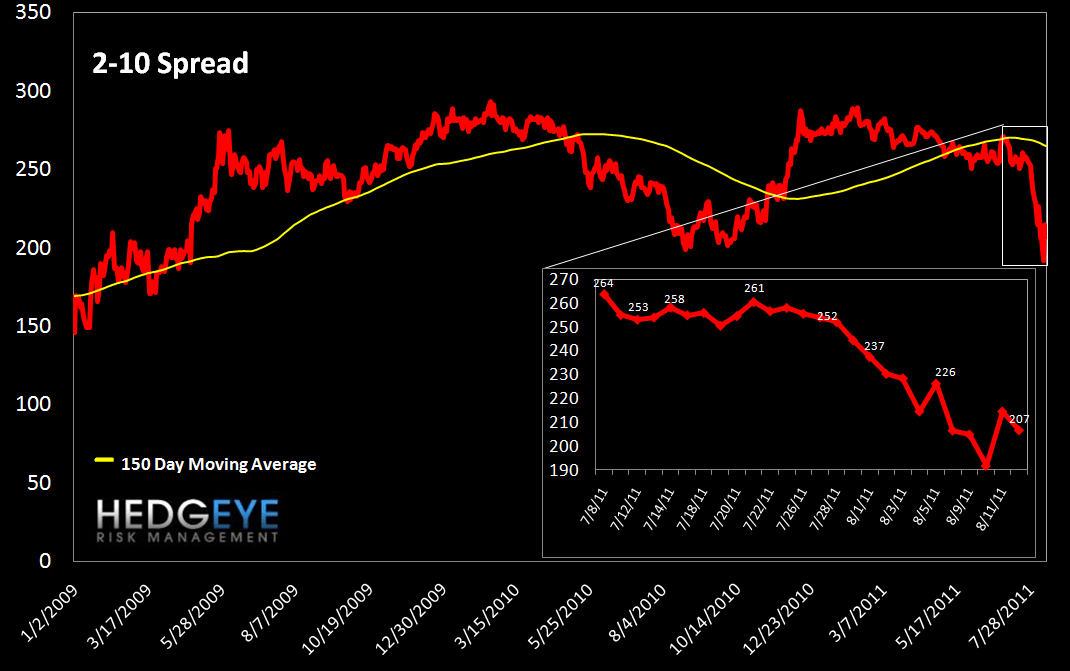
11. 2-10 Spread – We track the 2-10 spread as a proxy for bank margins. Last week the 2-10 spread tightened a further 19 bps to 207 bps.
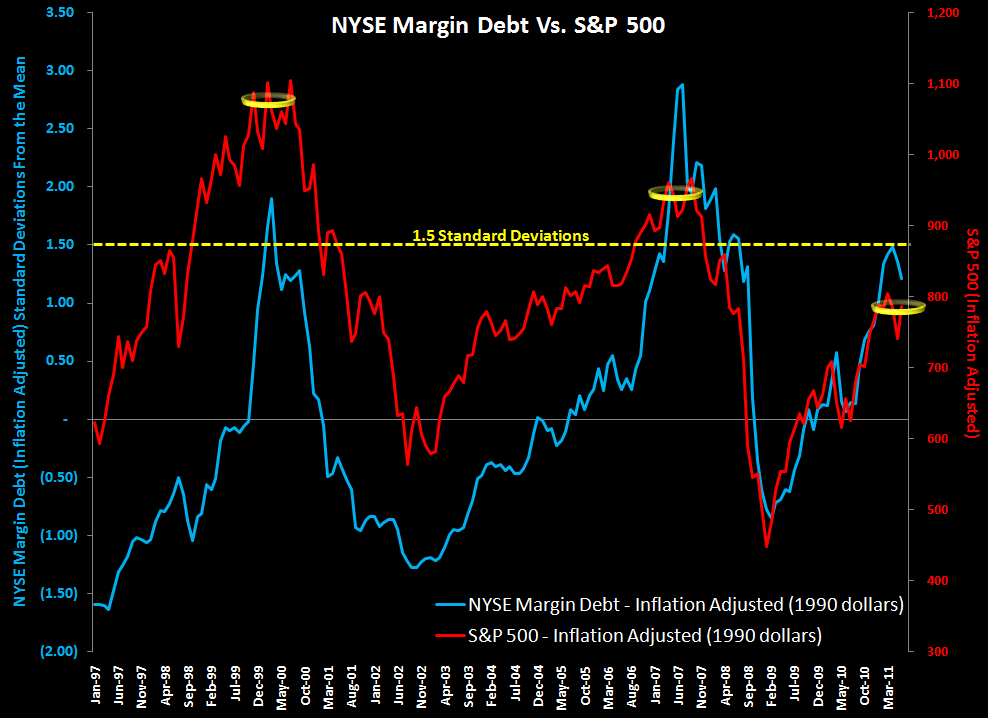
Margin Debt Continues to Fall
We publish NYSE Margin Debt every month when it’s released. This chart shows the S&P 500, inflation adjusted back to 1997, along with the inflation-adjusted level of margin debt (expressed as standard deviations from the long-run mean). As the chart demonstrates, higher levels of margin debt are associated with increased risk in the equity market. Our analysis shows that more than 1.5 standard deviations above the average level is the point where things start to get dangerous. In May, margin debt decreased $9.5B to $306B. On a standard deviation basis, margin debt fell to 1.21 standard deviations above the long-run average.
One limitation of this series is that it is reported on a lag. The chart shows data through June.
Joshua Steiner, CFA
Allison Kaptur
