Weekly footwear data registered a third consecutive decline last week confirming that sales have indeed turned sharply lower through the back half of July. Not surprisingly, FL and FINL are among the names that trade most heavily on these numbers. We are adjusting our estimates based on the latest data, but remain well above Street estimates for FL while FINL is more in-line. With that in mind there are several key factors to consider:
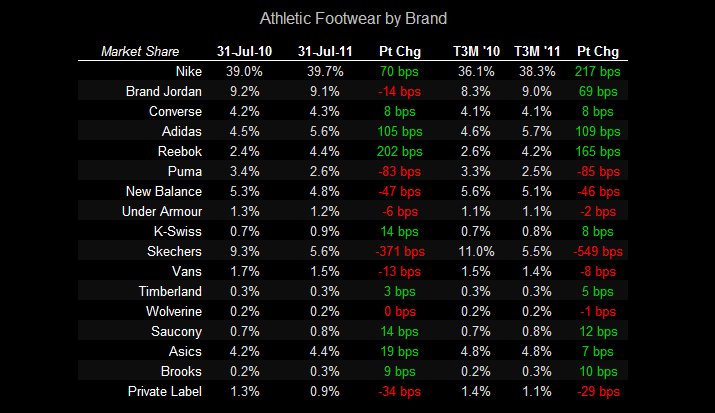
- Many investors still trade on these numbers with similar conviction to the prior sample set (before Jan ’11) when only athletic specialty channel sales were reported. With department stores and national shoe chains now included in the weekly data, the variability factor has increased substantially tracking 4%-6% below athletic specialty channel sales.
- In terms of sizing July sales, it represents roughly 7% of annual dollars – the same as May both of which are less significant than June, which was up 12.3% (see chart below).
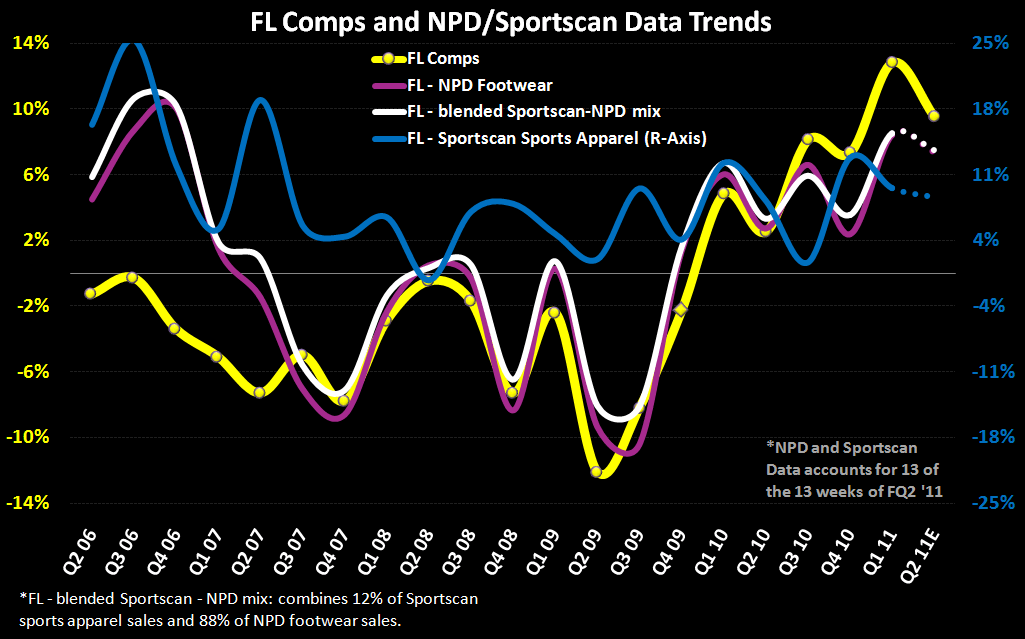
- Based on monthly data where the athletic specialty channel is broken out, sales were up 9.6% through the first two months of FL’s Q2. With weekly sales coming in down -2% in July and assuming at least a 4% adjustment, we assume July came in up +2%. This suggests comps are tracking at 7.5% in Q2. With FL coming in at least 200bps above our proprietary blended rate in each of the last three quarters, we have adjusted comps to +9.5% for the quarter with EPS shaking out at $0.17 for Q2 and $1.68 for the year well aboveconsensus at $0.12 and $1.57 respectively.
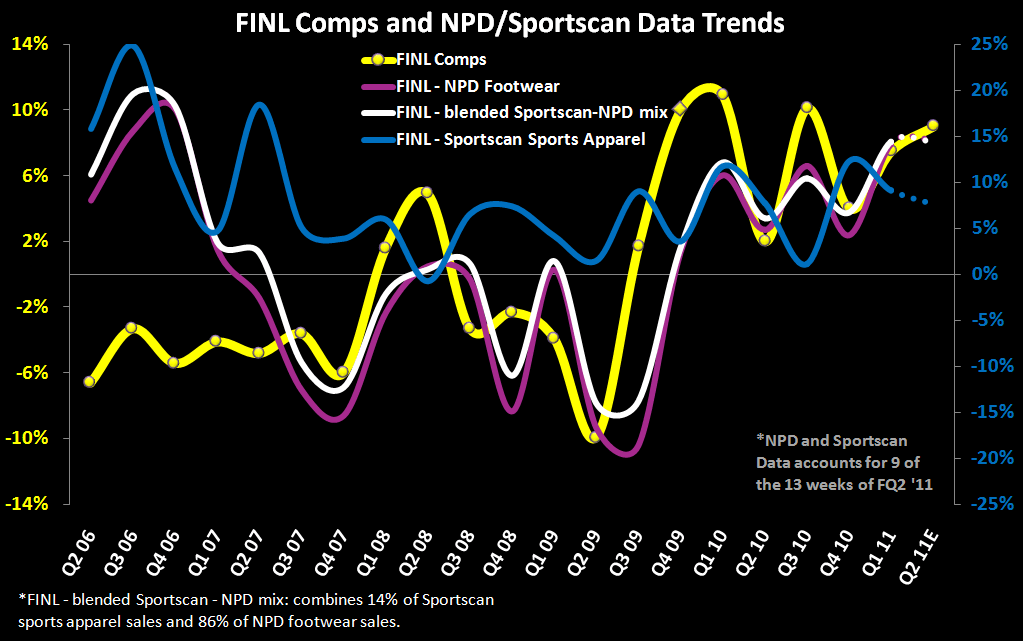
- Taking a similar look at FINL, which closes its books at the end of August and has a tighter performance range around the blended rate, we have adjusted comps to +8.5% for the quarter with EPS shaking out at $0.40 for Q2 and $1.56 for the year essentially in-line with consensus at $0.39 and $1.56 respectively. Keep in mind, that August is the second largest month of the year from a dollar perspective aside from December and will be key to locking in the quarter for FINL.
- Importantly, July monthly numbers will be out next Monday ahead of FL’s earnings release Thursday afternoon providing further clarity to our adjustment to weekly figures. We’ll update our view if necessary as soon as we have those numbers.
- Lastly in looking at footwear trends over the last few weeks, sales declines have come from lower unit volume depsite relatively stable ASP trends +/- 1%. This suggests that we could see an increase in promotional acitivity during the critical BTS selling season as retailers look to drive top-line results.


Casey Flavin
Director
