July gaming volumes hit a new monthly record besting even the seasonally stronger month of May
Thoughts
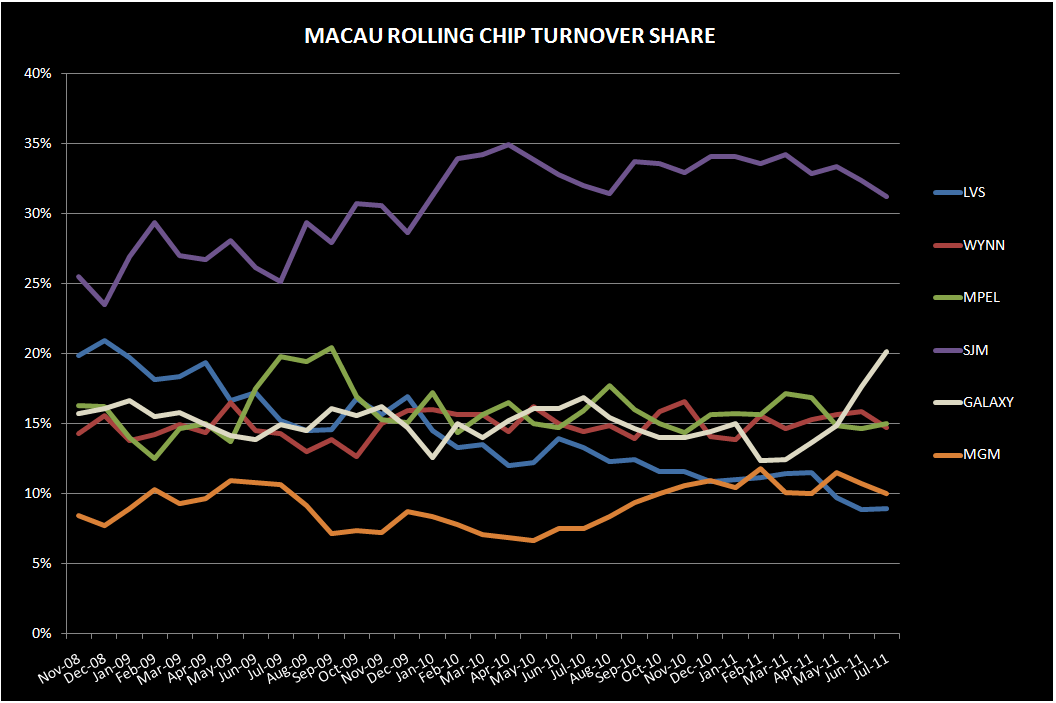
One of the big market takeaways is that July Rolling Chip volume actually exceeded the record set in May despite May typically being a much stronger month (Golden Week). VIP hold percentage was slightly below that of May so that is why GGR didn’t set a new record in July. Perhaps even more encouraging is that Mass table revenue grew over 41%, the highest YoY growth for that segment since May of 2010, and a new monthly record.
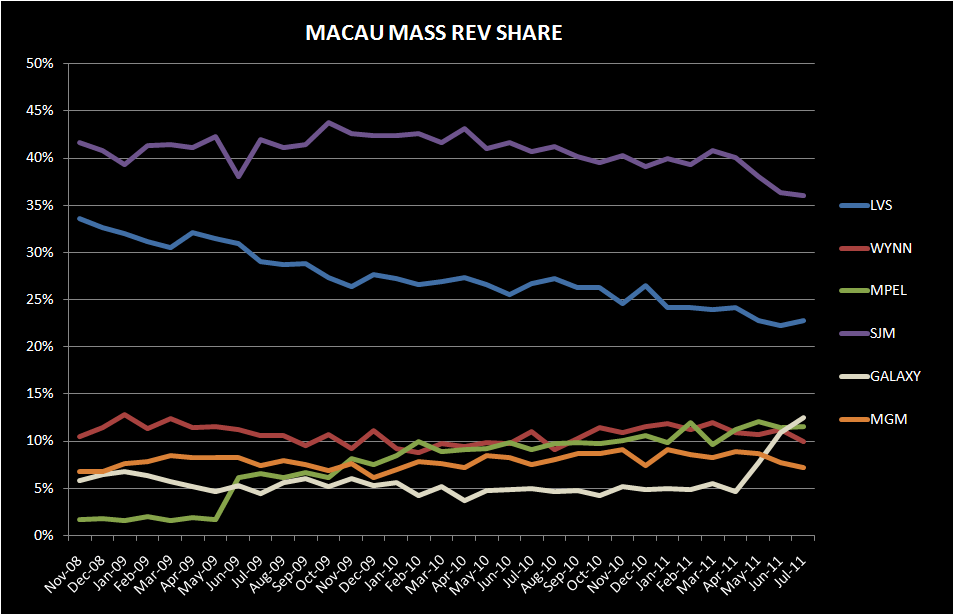
After reviewing the detail, we still think MPEL was the standout as market share increased 170bps sequentially to 15.6% in July, above what it was trending even before Galaxy Macau opened. Importantly, the gains were not just hold related - VIP volume increased 40bps from June, Mass maintained its above trend share of 11.5% from June, and slot share actually increased 200bps. On a YoY basis, MPEL grew its GGR 56%, well above market growth. These metrics bode well for Q3 profitability, particularly relative to the Street.
As we previously discussed, Wynn’s market share was strong again in July at 15.2%, maintaining its pre-Galaxy share. However, the details are not as favorable. Wynn lost 140bps of Mass share from June, falling below 10% for the first time since August. They also lost 110bps of VIP volume share but made up for it with a very high VIP hold percentage. In essence, luck made the month for Wynn.
It’s been well publicized that MGM lost a lot of share in July and the details show the breadth of that decline – hold, Mass, and Rolling Chip volume all played a role. LVS also lost a lot of share but that was related to a very high hold % in June although July hold was still well above normal.
Summary
Total gross gaming revenues increased 48% YoY to HK$23.5 billion. We estimate that direct play was 6.3% in July vs. 7.9% last year. Adjusted for direct play volumes, market hold was 3.06% vs. 3.17% last year. If we normalize hold levels, July would have been even stronger growth month – up 52% YoY. August will have an easier hold comparison which should benefit YoY growth rates.
Y-o-Y Table Revenue Observations:
Total table revenues grew 49% YoY this month, on top of 73% growth last July. July Mass revs rose 41%; VIP revs grew 51%; and Junket RC soared 60%.
For the 5th straight month, LVS table revenues grew the slowest – at 13%. Over the 10 months LVS’s table revenues have grown at roughly 1/3 of the market’s pace.
- Sands was up 18% YoY, driven by a 25% rise in VIP and 8% increase in Mass
- Junket RC was up 17%
- Sands held low in July, however, they held even lower last year. Adjusted for 12% direct play (in-line with 2Q11), hold was about 2.5%, compared with 2.3% hold in July 2010 assuming 14% direct play (in-line with 3Q10).
- Venetian was up 11% in July. Mass rose 28%, while VIP barely budged – up only 0.5% impacted by lower YoY hold and below average Junket RC growth
- Junket VIP RC grew 12%
- Hold was a little low in July at 2.7%, based on 22% direct play (in-line with 2Q11). In July 2010, hold was 2.9%, assuming 23% direct play.
- Four Seasons was up 13% YoY driven by 12% VIP growth and 24% growth in Mass.
- Junket VIP RC tumbled 26%. Four Seasons was the only casino we track to have an decline in Junket RC YoY.
- Results would have been worse if not for very high hold. Assuming 41% direct play (in-line with 2Q11), we estimate hold was 5.6% compared to 3.6% in July 2010 assuming the same direct play percentage.
Wynn table revenues were up 54%
- Mass was up 27% and VIP increased 60%
- Junket RC increased 63%
- Assuming 8% of total VIP play was direct (in-line with 2Q11) , we estimate that hold was 3.4% compared to 3.3% last year (assuming 13% direct play – in-line with 3Q10)
MPEL table revenues grew 57%, driven by Mass growth of 79% and VIP growth of 53%
- Altira revenues soared was up 115% with Mass up 70% while VIP ballooned 118%, benefiting from high hold and easy comparisons
- VIP RC increased 54%
- We estimate that hold was 3.5% vs. 2.5% last year
- CoD table revenue was up 33%, driven by 80% growth in Mass and 23% growth in VIP, dampened by a difficult YoY hold comparison
- Junket VIP RC grew 47%
- Assuming 14% direct play levels, hold was 3.1% in July compared to 3.6% last year (assuming 13% direct play in line with 3Q10)
SJM revs grew 29%
- Mass was up 25% and VIP was up 31%
- Junket RC was up 56%
Galaxy table revenue skyrocketed 122%. Mass went up by 252% and VIP rose by 109%.
- StarWorld table revenues grew 43%
- Mass grew 37% and VIP grew 44%
- Junket RC grew 13%
- Hold was high at 3.6%
- Galaxy Macau's total gaming revenues were $236MM, 47% higher than June
- Mass table revenue grew to $45MM, up 34% MoM
- VIP table revenue of $191MM, up 51% with RC volume of $5.8BN. Assuming no direct play, hold was 3.3%.
MGM table revenue grew 71%.
- Mass revenue growth was 35%, while VIP was up 85%
- Junket RC grew 112%, marking the 11th straight month that MGM has led in growth for this category- which is impressive given the opening of Galaxy Macau
- Assuming direct play levels of 13%, we estimate that hold was only 2.3% this month vs. 2.6% in July 2010
Sequential Market Share (property specific details are for table share while company-wide statistics are calculated on total GGR, including slots):
LVS share in July fell 1.4% sequentially to 14.5%. This compares to 6 month trailing market share of 16.6% and 2010 average share of 19.5%
- Sands' share dropped 1.1% to 4%, an all-time low in share equal to that of May’s
- The increase in share was primarily attributed to a 130bps drop in VIP rev share
- Venetian’s share dropped 2.2% to 7.2% share, an all-time low since opening
- VIP share plummeted 2.9% to 5.2%, also setting a record low for the property
- Junket RC increased 30bps to 4.6%, bouncing off an all-time low set in June
- FS share increased 1.8% to 2.7%
- VIP share increased 2.3% to 3.0%
- Mass share increased 40bps to 1.8%
- Junket RC ticked down 10bps to 1.0%
WYNN share was flat MoM at 15.2%, helped by high hold. July’s share was above its 6 month trailing average share of 14.8% and 2010 average share of 14.9%.
- Mass market share fell 1.4% to 9.9% - Wynn’s worst share since August 2010
- Losses in Mass were offset by VIP market share gains of 40bps to 16.7%
- Junket RC share fell 1.1% to 14.7%, below its 6 and 12 month trailing average of 15.1%
After Galaxy, MPEL market share rose the most with a MoM gain of 1.7% to 15.6%, above their average 6 month trailing share of 14.9% and 2010 share of 14.6%.
- Altira share ticked up 10bps to 6.1%, compared to 5.6% average share in 2010
- CoD’s share increased 1.5% sequentially to 9.3%
- Mass market share inched up 20bps to 10.1% - second only to Venetian and ahead of Wynn’s share
- VIP share jumped 1.9% to 9.1%
SJM share fell 1.2% to 27.8% in July- the lowest share since September 2008 and below its 6-month trailing average of 31.1% and 2010 average of 31.3%.
- Mass market share fell 20bps to 36.1% - an all time low
- VIP share fell 1.3% to 26.3%
- Junket RC share 1.2% to 33.4%
Galaxy continued its momentum from Galaxy Macau, gaining 3.4% to 18.8%, its highest share since August 2007. July share compares with an average share of 10.9% in 2010 and a 6 month trailing average of 11.6%.
- Galaxy Macau garnered 8.1% market share, up from 6.5% in June
- Mass market share gained 130bps to 6.9%, VIP share gained 180bps to 8.5% and RC share gained 230bps to 8.4%.
- Surprisingly, Starworld also gained 1.7% of market share to 9.4%, 30 bps above its TTM pre-Galaxy Macau level
- Mass market share ticked down 10bps to 2.8% while VIP share rose 170bps to 11.4%
MGM lost the most market share in July with share falling 2.4% to 8.1% due to very low table hold. July share compares with an average share of 8.8% in 2010 and a 6 month trailing average of 11%.
- Mass share decreased 60bps to 7.2% - the lowest level since April 2010
- VIP share plummeted 3.1% to 8.1%
- Junket RC decreased 70bps to 10%, which was still materially above the property’s 2010 average of 8.4% but below its 6 month trailing average of 10.8%
Slot Revenue:
Slot revenue grew 34% YoY in July to $121MM, up 8% sequentially
- Galaxy slot revenues grew at a white hot pace of 644% YoY, reaching $13MM
- Wynn slot revenues grew the least at just 3% YoY, losing $2MM sequentially to $21MM
- MGM had the second best growth at 50% YoY, increasing $1MM sequentially to $16MM
- MPEL’s slot revenue grew 42% YoY, increasing $4MM sequentially to $23MM
- SJM’s slot revenues fell $3MM sequentially to $15MM, up 6% YoY
- LVS slot revenues grew 21% YoY to $32MM