This week's notable callouts include financial and sovereign CDS plummeting in the wake of the Greek debt deal. While this clearly reflects increased bullishness by the market, it also appears likely that the CDS market is pricing in the loss of hedge effectiveness created by policymakers adamant about avoiding a technical credit event. Bucking the trend were the mortgage insurers, where swaps blew out further across the group.
Margin Debt Continues to Fall
We publish NYSE Margin Debt every month when it’s released. This chart shows the S&P 500, inflation adjusted back to 1997, along with the inflation-adjusted level of margin debt (expressed as standard deviations from the long-run mean). As the chart demonstrates, higher levels of margin debt are associated with increased risk in the equity market. Our analysis shows that more than 1.5 standard deviations above the average level is the point where things start to get dangerous. In May, margin debt decreased $9.5B to $306B. On a standard deviation basis, margin debt fell to 1.21 standard deviations above the long-run average.
One limitation of this series is that it is reported on a lag. The chart shows data through June.

Financial Risk Monitor Summary (Across 3 Durations):
- Short-term (WoW): Positive / 5 of 11 improved / 2 out of 11 worsened / 4 of 11 unchanged
- Intermediate-term (MoM): Negative / 6 of 11 improved / 2 of 11 worsened / 3 of 11 unchanged
- Long-term (150 DMA): Negative / 3 of 11 improved / 5 of 11 worsened / 3 of 11 unchanged
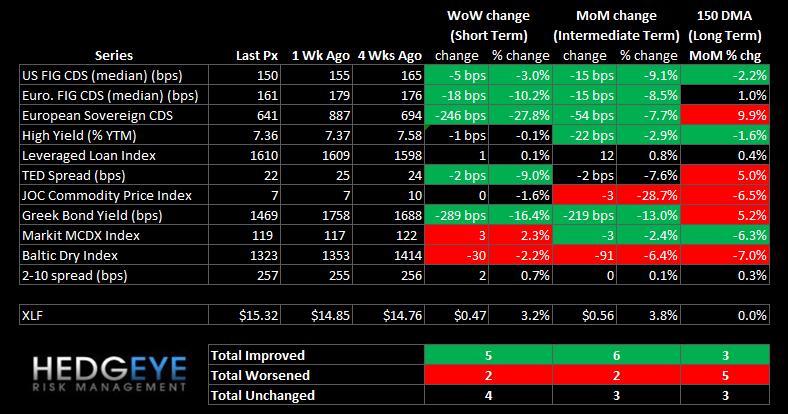
1. US Financials CDS Monitor – Swaps were mixed across domestic financials last week, tightening for 16 of the 28 issuers and widening for 12. Mortgage insurers took it on the chin in the swaps market as well as in equity, as investors increasingly question their solvency. Meanwhile, the moneycenters and large broker-dealers benefited from the Greece deal.
Tightened the most vs last week: JPM, C, WFC
Widened the most vs last week: PMI, MTG, GNW
Tightened the most vs last month: C, WFC, MBI
Widened the most vs last month: PMI, MTG, GNW

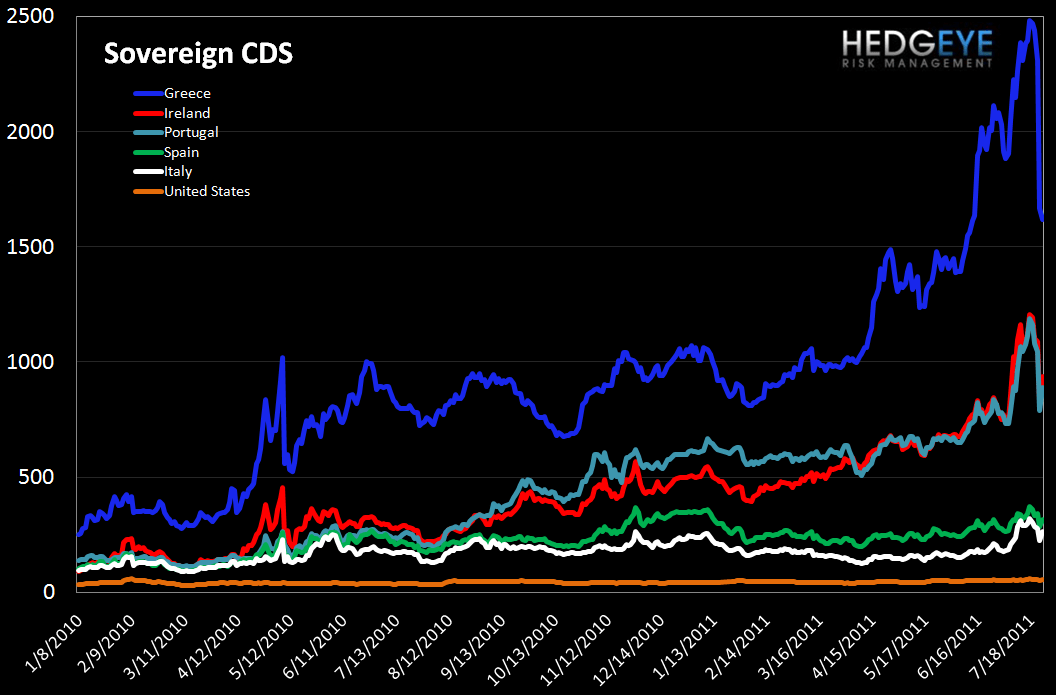
2. European Financials CDS Monitor – Banks swaps in Europe were mostly tighter last week. 34 of the 38 swaps were tighter and 4 widened.

3. European Sovereign CDS – European sovereign swaps collapsed following the Greece deal last weekend. Despite the haircuts included in the deal, ISDA ruled that the restructuring does not constitute a credit event, which means that CDS will not be triggered. As such, we expect that the CDS market is currently pricing in both improvement in sentiment around sovereign solvency and decreased hedge effectiveness. A credit default swap is a useless hedge instrument if policymakers manage to create bailout packages designed not to trigger it.
4. High Yield (YTM) Monitor – High Yield rates were flat last week, ending at 7.36 versus 7.37 the prior week.

5. Leveraged Loan Index Monitor – The Leveraged Loan Index was close to flat last week, ending at 1610.

6. TED Spread Monitor – The TED spread fell slightly, ending the week at 22.3 versus 24.5 the prior week.

7. Journal of Commerce Commodity Price Index – Last week, the JOC index was close to flat, falling less than one point to 7.2.

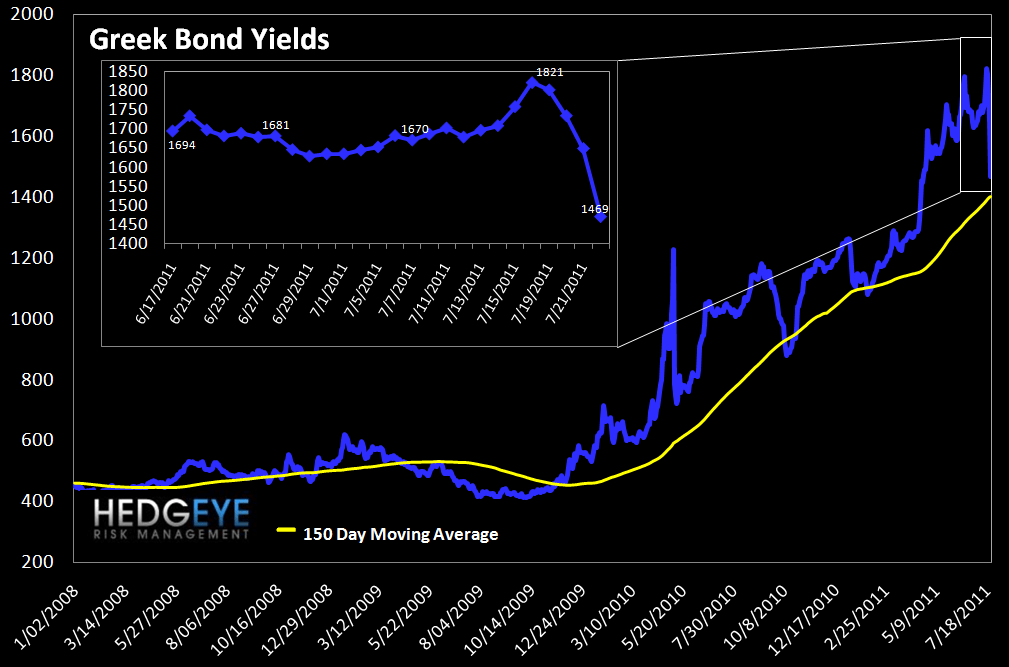
8. Greek Bond Yields Monitor – We chart the 10-year yield on Greek bonds. Last week yields fell 289 bps or 16%, ending the week at 1469.
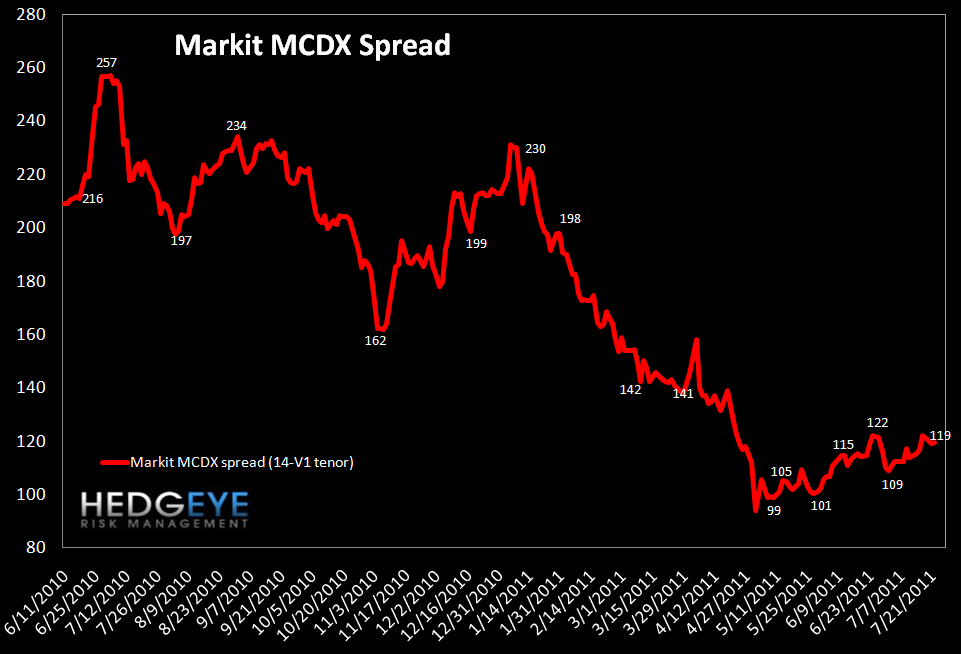
9. Markit MCDX Index Monitor – The Markit MCDX is a measure of municipal credit default swaps. We believe this index is a useful indicator of pressure in state and local governments. Markit publishes index values daily on six 5-year tenor baskets including 50 reference entities each. Each basket includes a diversified pool of revenue and GO bonds from a broad array of states. We track the 14-V1. After bottoming in April, the index has been moving gradually higher. Last Friday, spreads closed at 119 bps.
10. Baltic Dry Index – The Baltic Dry Index measures international shipping rates of dry bulk cargo, mostly commodities used for industrial production. Higher demand for such goods, as manifested in higher shipping rates, indicates economic expansion. Last week the series fell 30 points to close at 1323.

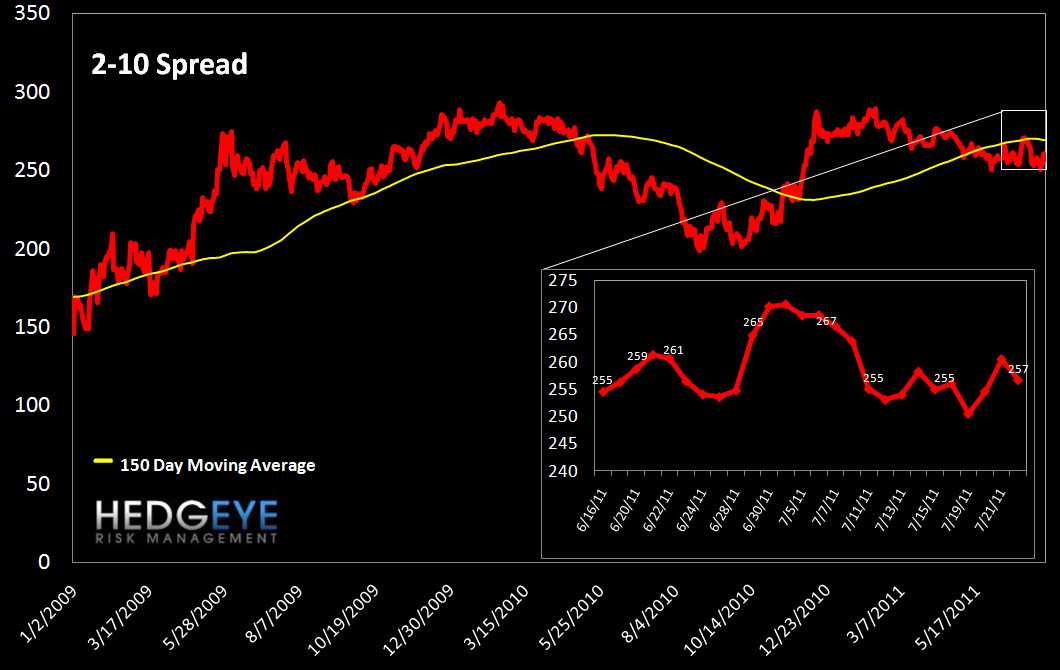
11. 2-10 Spread – We track the 2-10 spread as a proxy for bank margins. Last week the 2-10 spread widened 2 bps to 257 bps.
12. XLF Macro Quantitative Setup – Our Macro team sees the setup in the XLF as follows: 0.7% upside to TRADE resistance, 1.6% downside to TRADE support.

Joshua Steiner, CFA
Allison Kaptur