This week's notable callouts include Italian Bank swaps and European sovereign swaps blowing out.
Financial Risk Monitor Summary (Across 3 Durations):
- Short-term (WoW): Negative / 2 of 10 improved / 3 out of 10 worsened / 5 of 10 unchanged
- Intermediate-term (MoM): Negative / 1 of 10 improved / 4 of 10 worsened / 5 of 10 unchanged
- Long-term (150 DMA): Negative / 1 of 10 improved / 5 of 10 worsened / 4 of 10 unchanged

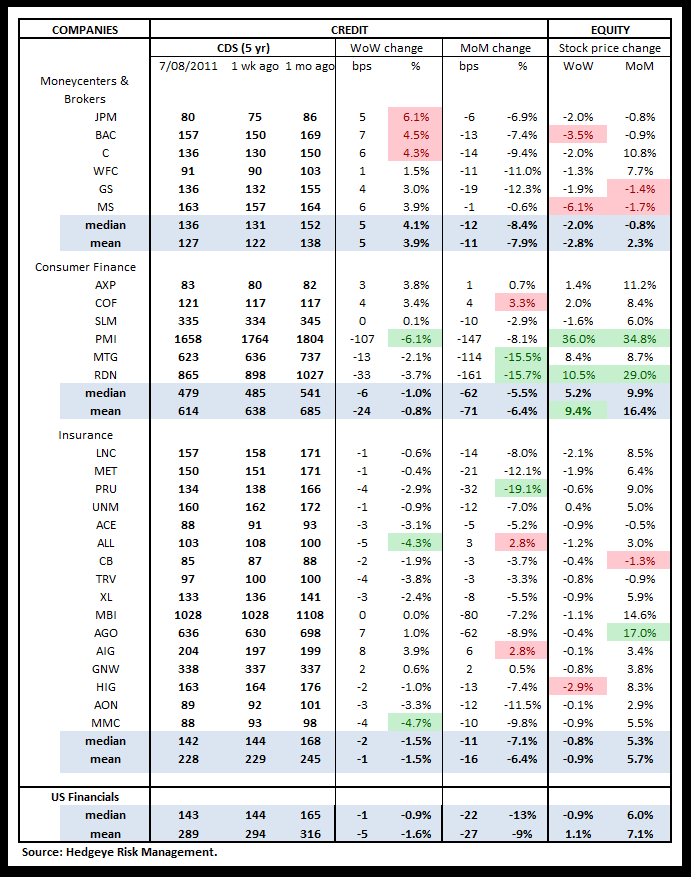
1. US Financials CDS Monitor – Swaps were mixed for domestic financials last week, tightening for 15 of the 28 issuers and widening for 13.
Widened the most vs last week: JPM, BAC, C
Tightened the most vs last week: PMI, ALL, MMC
Widened the most vs last month: COF, ALL, AIG
Tightened the most vs last month: MTG, RDN, PRU
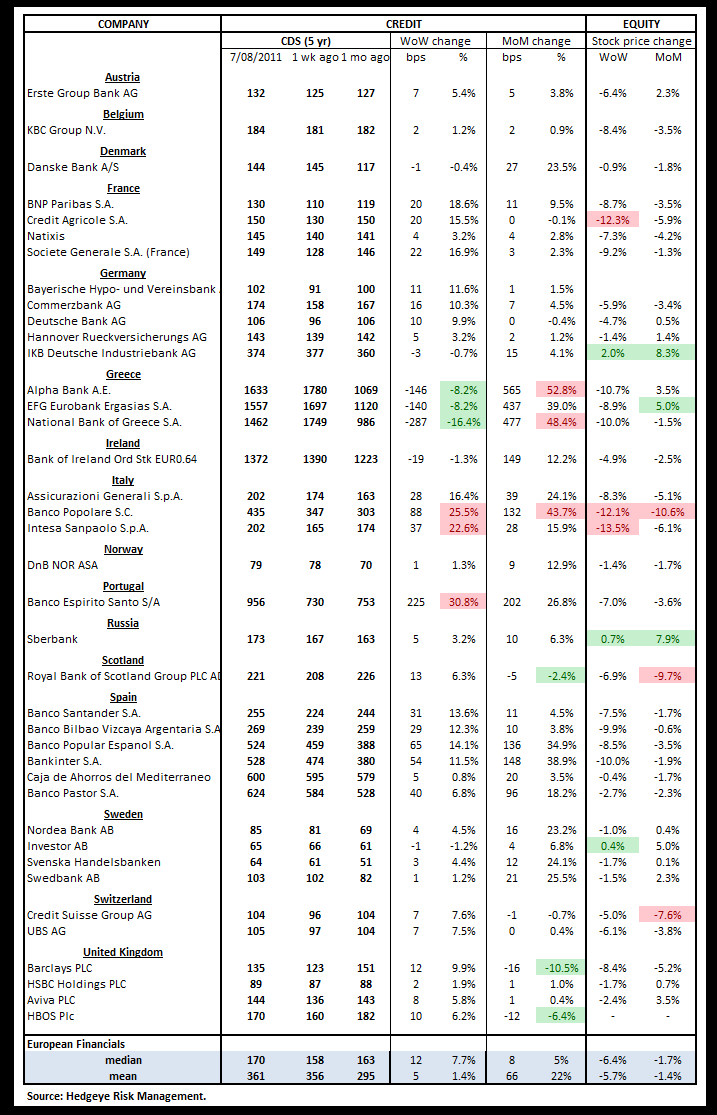
2. European Financials CDS Monitor – Banks swaps in Europe were mostly wider last week. 32 of the 38 swaps were wider and 7 tightened, with one unchanged.
3. European Sovereign CDS – European sovereign swaps continued to blow out significantly higher, increasing an average of 37% WoW.

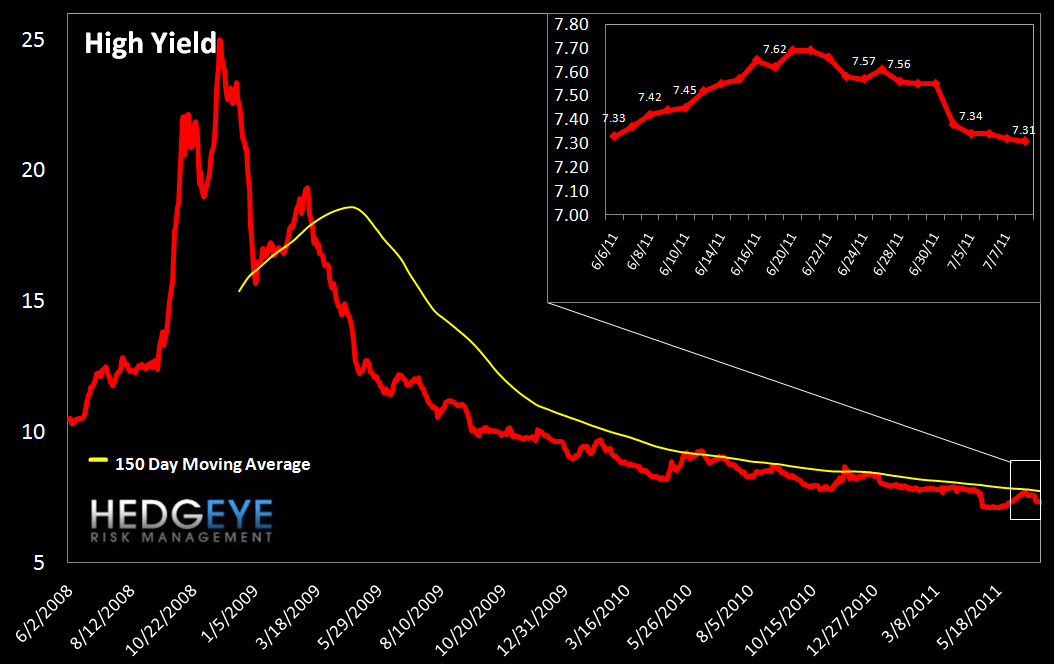
4. High Yield (YTM) Monitor – High Yield rates edged moved lower last week, ending at 7.31 versus 7.38 the prior week.
5. Leveraged Loan Index Monitor – The Leveraged Loan Index climbed slightly last week, ending the week 4 points higher than the previous week at 1609.

6. TED Spread Monitor – The TED spread fell slightly, ending the week at 22.6 versus 23.0 the prior week.

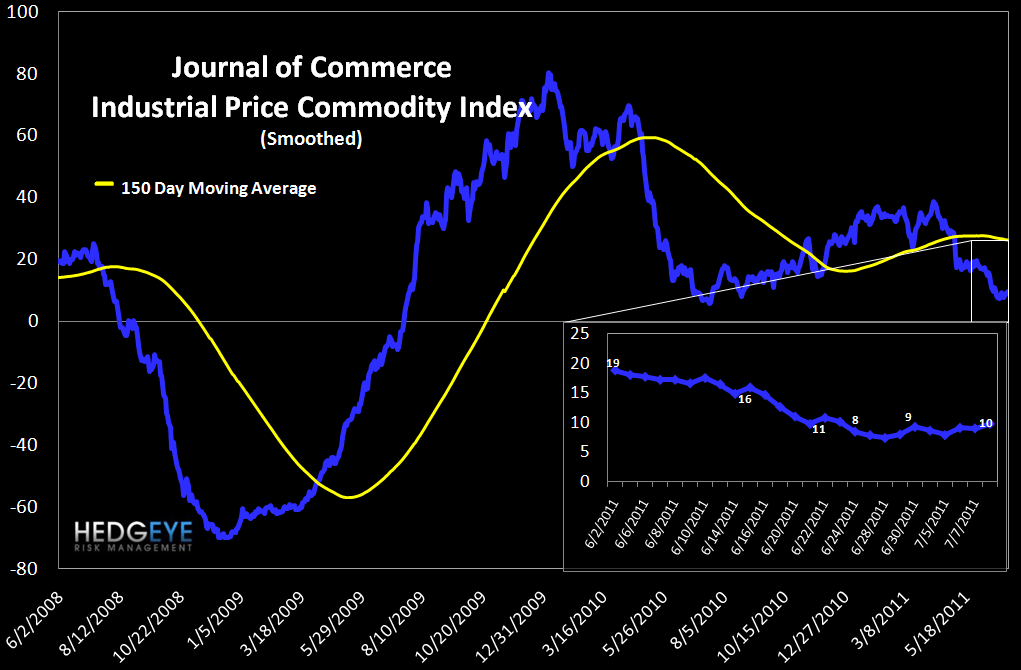
7. Journal of Commerce Commodity Price Index – Last week, the JOC index rose less than one point to 9.7.
8. Greek Bond Yields Monitor – We chart the 10-year yield on Greek bonds. Last week yields rose 52 bps, ending the week at 1686.

9. Baltic Dry Index – The Baltic Dry Index measures international shipping rates of dry bulk cargo, mostly commodities used for industrial production. Higher demand for such goods, as manifested in higher shipping rates, indicates economic expansion. Last week the series rose slightly, climbing 27 points versus the prior week.

10. 2-10 Spread – We track the 2-10 spread as a proxy for bank margins. Last week the 2-10 spread tightened 7 bps to 264 bps.
<chart11>
11. XLF Macro Quantitative Setup – Our Macro team sees the setup in the XLF as follows: 2.1% upside to TRADE resistance, 2.3% downside to TRADE support.

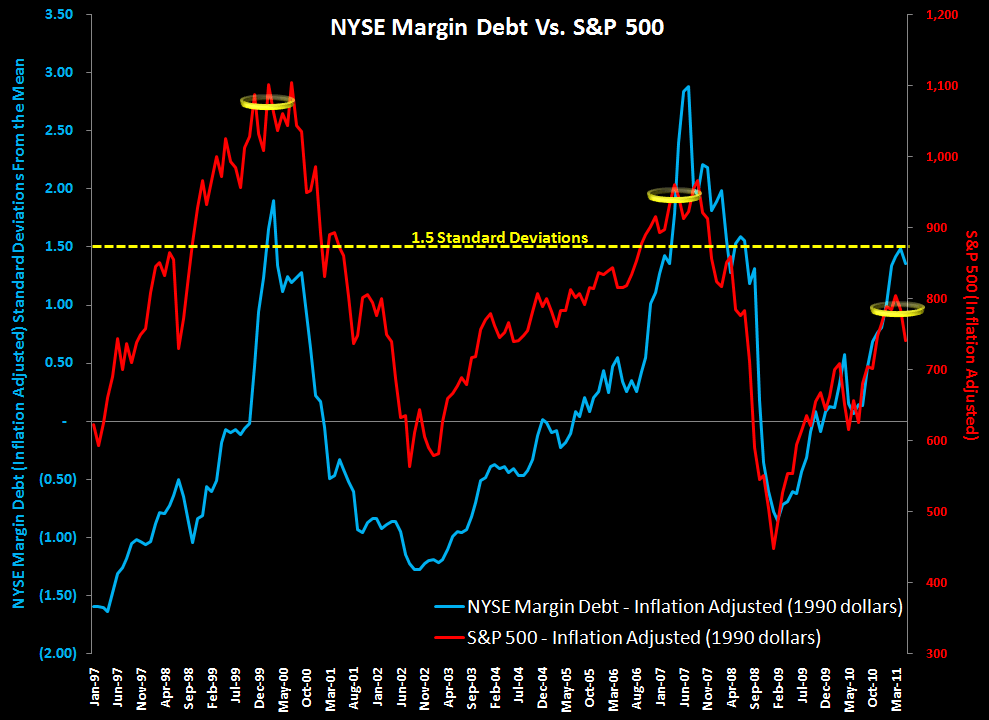
Margin Debt Back Off of Recent Highs
We publish NYSE Margin Debt every month when it’s released. This chart shows the S&P 500, inflation adjusted back to 1997, along with the inflation-adjusted level of margin debt (expressed as standard deviations from the long-run mean). As the chart demonstrates, higher levels of margin debt are associated with increased risk in the equity market. Our analysis shows that more than 1.5 standard deviations above the average level is the point where things start to get dangerous. In May, margin debt decreased $5.3B to $315B. On a standard deviation basis, margin debt fell to 1.36 standard deviations above the long-run average.
One limitation of this series is that it is reported on a lag. The chart shows data through May.
Joshua Steiner, CFA
Allison Kaptur
