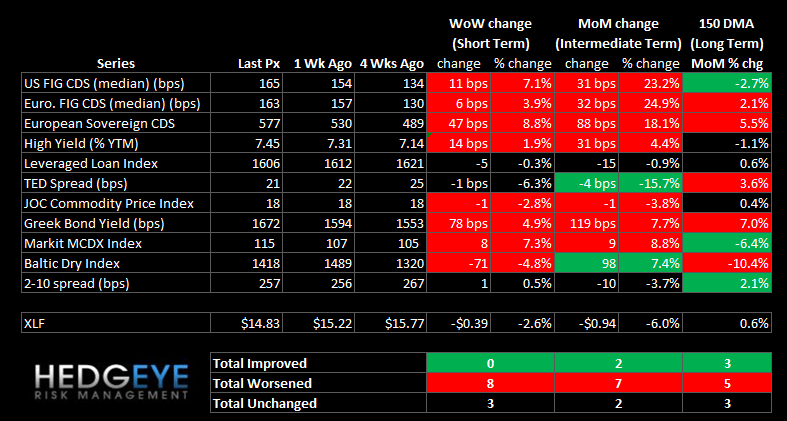
This week there are no positive signals on a short-term basis. Mortgage Insurers continue their slide, while EU Sovereign CDS continues to back up.
Financial Risk Monitor Summary (Across 3 Durations):
- Short-term (WoW): Negative / 0 of 11 improved / 8 out of 11 worsened / 3 of 11 unchanged
- Intermediate-term (MoM): Negative / 2 of 11 improved / 7 of 11 worsened / 2 of 11 unchanged
- Long-term (150 DMA): Neutral / 3 of 11 improved / 5 of 11 worsened / 3 of 11 unchanged
1. US Financials CDS Monitor – Swaps widened significantly across domestic financials last week, widening for all 28 of the reference entities by an average of 15% (median 7%).
Widened the most vs last week: PMI, MTG, RDN
Widened the least vs last week: AON, MMC, GS
Widened the most vs last month: PMI, MTG, RDN
Widened the least vs last month: TRV, AON, MMC

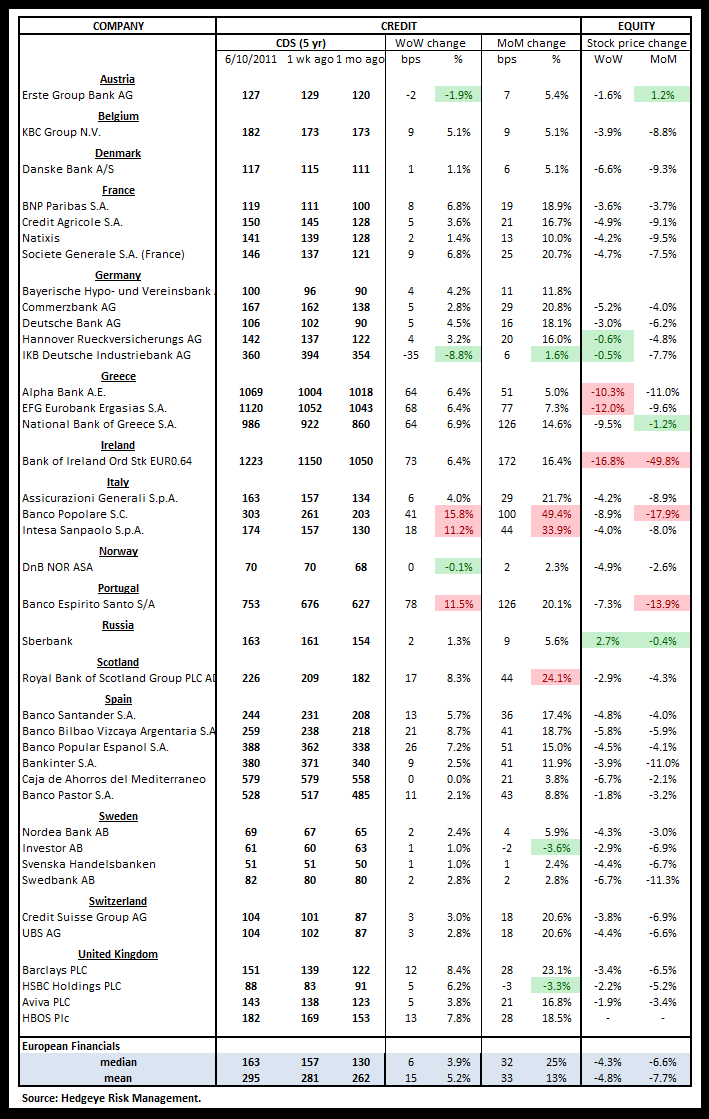
2. European Financials CDS Monitor – Banks swaps in Europe were wider last week. 35of the 38 swaps were wider and only 3 tightened.
3. European Sovereign CDS – European sovereign swaps rose higher again last week, widening 47 bps on average.

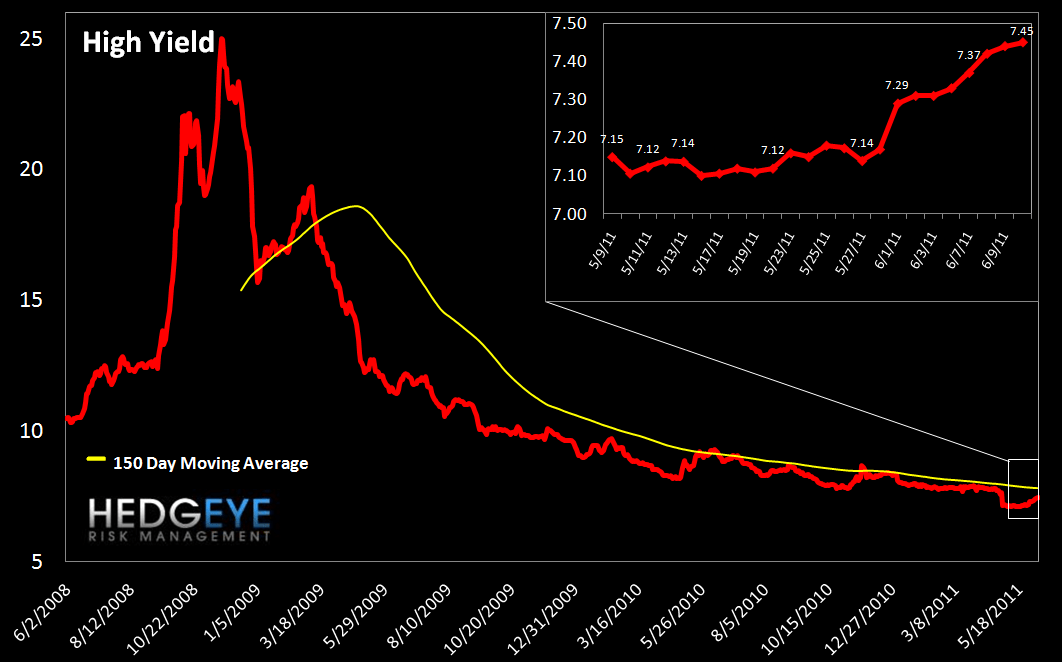
4. High Yield (YTM) Monitor – High Yield rates moved higher last week, ending at 7.45 versus 7.31 the prior week.
5. Leveraged Loan Index Monitor – The Leveraged Loan Index fell more than five points last week, closing at 1606 versus 1612 the prior week.

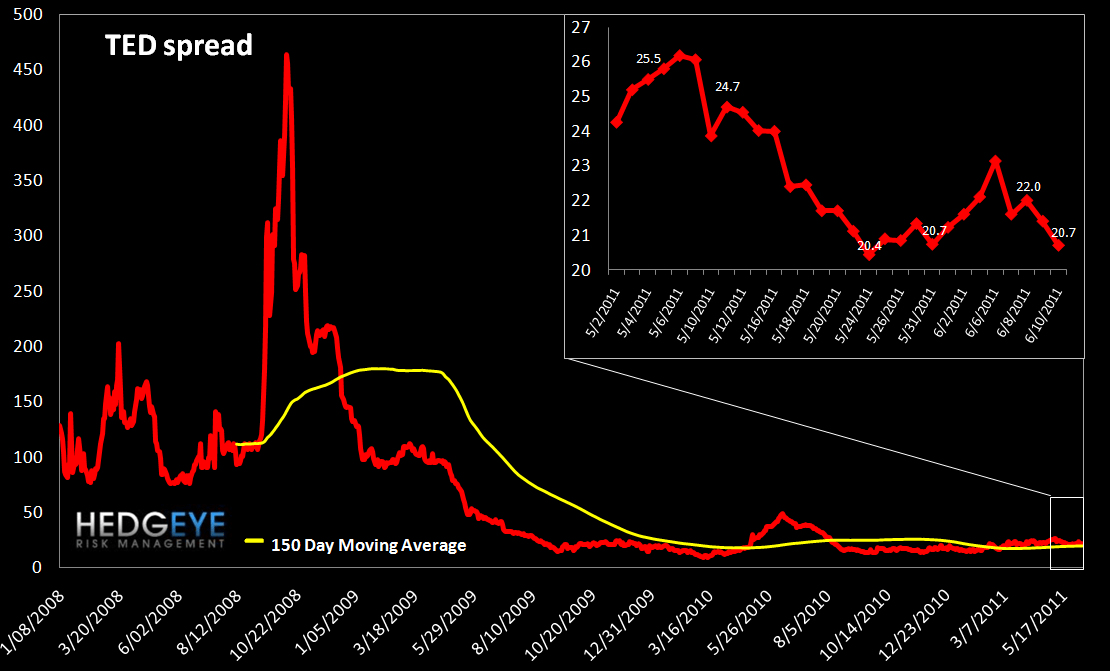
6. TED Spread Monitor – The TED spread fell slightly last week, ending the week at 20.7 versus 22.1 the prior week.
7. Journal of Commerce Commodity Price Index – Last week, the JOC index continued to bounce along at a low level, falling less than a point versus the prior week.

8. Greek Bond Yields Monitor – We chart the 10-year yield on Greek bonds. Last week yields rose 78 bps.

9. Markit MCDX Index Monitor – The Markit MCDX is a measure of municipal credit default swaps. We believe this index is a useful indicator of pressure in state and local governments. Markit publishes index values daily on six 5-year tenor baskets including 50 reference entities each. Each basket includes a diversified pool of revenue and GO bonds from a broad array of states. We track the 14-V1. Last week spreads were rose to 115 from 107 the prior week.

10. Baltic Dry Index – The Baltic Dry Index measures international shipping rates of dry bulk cargo, mostly commodities used for industrial production. Higher demand for such goods, as manifested in higher shipping rates, indicates economic expansion. Early in the year, Australian floods and oversupply pressured the Index, driving it down 30% before bouncing off the lows. Last week the series fell 71 points.

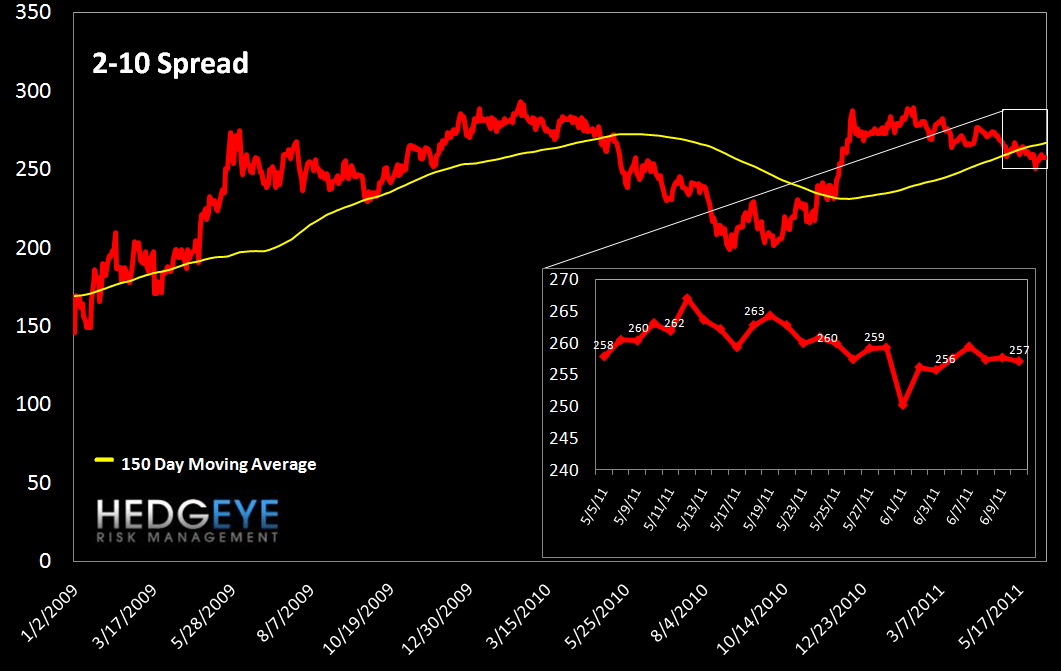
11. 2-10 Spread – We track the 2-10 spread as a proxy for bank margins. Last week the 2-10 spread tightened 4 bps to 256 bps.
12. XLF Macro Quantitative Setup – Our Macro team sees the setup in the XLF as follows: 1.9% upside to TRADE resistance, 2.4% downside to TRADE support.

Margin Debt Approaching Prior Pre-Crash Highs
We are now publishing NYSE Margin Debt every month when it’s released. This chart shows the S&P 500, inflation adjusted back to 1997, along with the inflation-adjusted level of margin debt (expressed as standard deviations from the long-run mean). As the chart demonstrates, higher levels of margin debt are associated with increased risk in the equity market. Our analysis shows that more than 1.5 standard deviations above the average level is the point where things start to get dangerous. Currently, we are very close to that level – April margin debt hit 1.49 standard deviations above the average.
One limitation of this series is that it is reported on a lag. The chart shows data through April.

Joshua Steiner, CFA
Allison Kaptur