Financial Risk Monitor Summary (Across 3 Durations):
- Short-term (WoW): Negative / 2 of 11 improved / 4 out of 11 worsened / 5 of 11 unchanged
- Intermediate-term (MoM): Negative / 2 of 11 improved / 3 of 11 worsened / 6 of 11 unchanged
- Long-term (150 DMA): Neutral / 4 of 11 improved / 4 of 11 worsened / 3 of 11 unchanged

1. US Financials CDS Monitor – Swaps widened across domestic financials, widening for 20 of the 28 reference entities and tightening for 8.
Widened the most vs last week: GS, PMI, PRU
Tightened the most vs last week: ACE, MBI, GNW
Widened the most vs last month: GS, PMI, MTG
Tightened the most vs last month: ACE, ALL, TRV

2. European Financials CDS Monitor – Banks swaps in Europe were evenly split last week, widening for 19 of the 39 reference entities and tightening for 19, with one flat.

3. European Sovereign CDS – European sovereign swaps fell last week, dropping 32 bps on average.

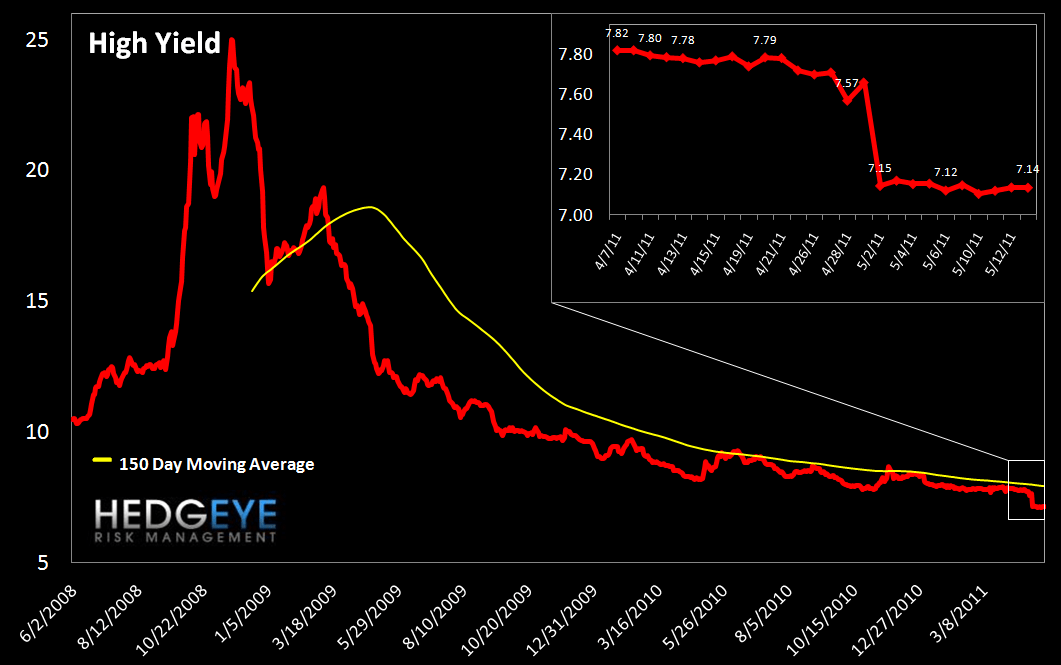
4. High Yield (YTM) Monitor – High Yield rates rose slightly last week, ending at 7.14 versus 7.12 the prior week. A data error or methodology change appears to be the cause of the step function in the Bloomberg series. We are awaiting clarification on this shift.
5. Leveraged Loan Index Monitor – The Leveraged Loan Index remained flat at 1621 again last week.

6. TED Spread Monitor – The TED spread backed off its high last week, ending the week at 24.0 versus 26.2 the prior week.

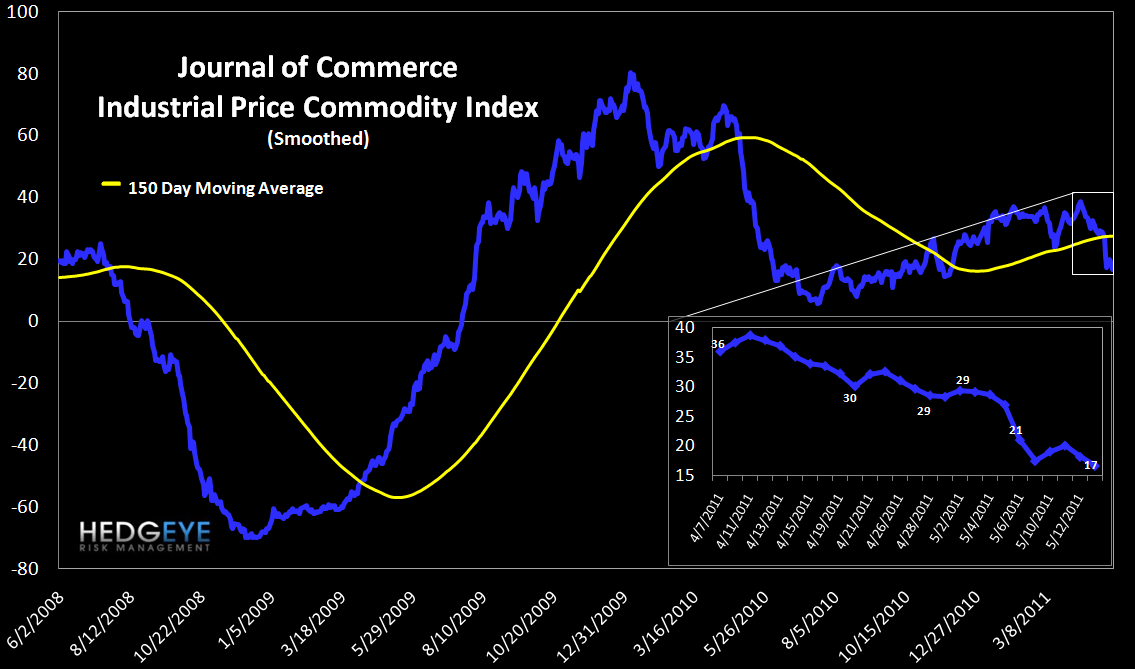
7. Journal of Commerce Commodity Price Index – Last week, the JOC index continued to decline, ending the week at 16.7, 4.4 points lower than the prior week. This fall brings the JOC to a new year-to-date low.
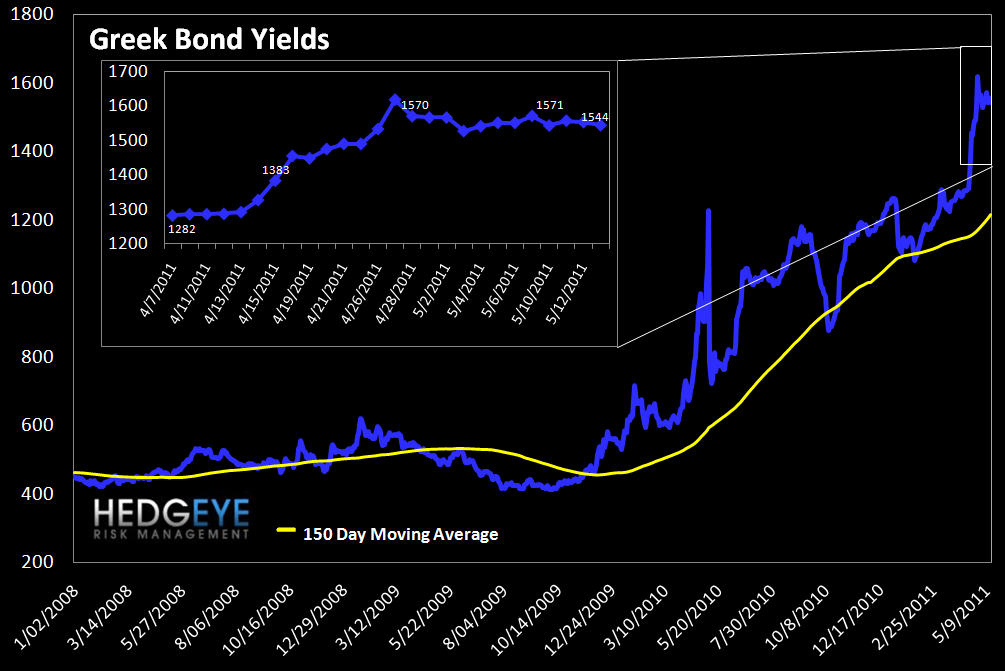
8. Greek Bond Yields Monitor – We chart the 10-year yield on Greek bonds. Last week yields fell 7 bps versus the prior Friday.
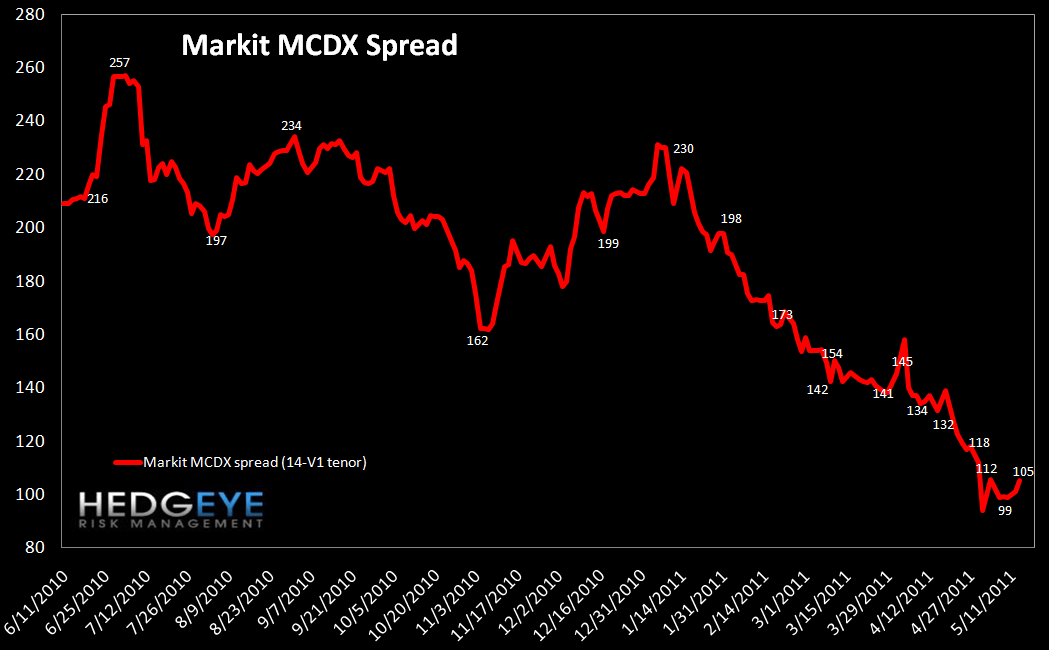
9. Markit MCDX Index Monitor – The Markit MCDX is a measure of municipal credit default swaps. We believe this index is a useful indicator of pressure in state and local governments. Markit publishes index values daily on six 5-year tenor baskets including 50 reference entities each. Each basket includes a diversified pool of revenue and GO bonds from a broad array of states. We track the 14-V1. Last week spreads ticked up to 105 from 99.
10. Baltic Dry Index – The Baltic Dry Index measures international shipping rates of dry bulk cargo, mostly commodities used for industrial production. Higher demand for such goods, as manifested in higher shipping rates, indicates economic expansion. Early in the year, Australian floods and oversupply pressured the Index, driving it down 30% before bouncing off the lows. Last week it fell 34 points to 1306.

11. 2-10 Spread – We track the 2-10 spread as a proxy for bank margins. Last week the 2-10 spread widened 3 bps to 263 bps.

12. XLF Macro Quantitative Setup – Our Macro team sees the setup in the XLF as follows: 2.0% upside to TRADE resistance, 0.1% downside to TRADE support.

Joshua Steiner, CFA
Allison Kaptur
