This note was originally published at 8am on May 09, 2011. INVESTOR and RISK MANAGER SUBSCRIBERS have access to the EARLY LOOK (published by 8am every trading day) and PORTFOLIO IDEAS in real-time.
“Man is free if he needs to obey no person but solely the laws.”
-Immanuel Kant
Kant was an 18th century German philosopher who over-weighted the value of real-life experience versus academic theory. Hayek used Kant’s aforementioned quote in “The Road To Serfdom” to support his point that unchecked government planning and the Rule of Law run counter to each other’s objectives.
“By giving the government unlimited powers, the most arbitrary rule can be made legal; and in this way a democracy may set up the most complete despotism imaginable.” (F.A. Hayek, “The Road To Serfdom”, 1944, page 119).
Since professional politicians gave Hank Paulson the TARP “bazooka” and started begging The Bernank for both “shock & awe” rate cuts to zero (2008), then The Quantitative Guessing (2009-2010), we’ve been waking up every morning trying to manage risk around Fiat Laws.
This morning’s speculation as to what the European Union is going to do with Greece’s $110,000,000,000 lifeline of bailout Euros is no different than the perpetual risk management exercise of Gaming Policy that we engage with here in the US. It’s a sad state of the “free” market union.
The good news is that we can measure the Global Macro risks embedded in the next Big Government Intervention mathematically. If the intermediate-term TREND of US Dollar Debauchery is going to change, the currency market is going to signal that to us in real-time.
Last week’s short squeeze in the US Dollar did exactly what we thought it would do if and when it stopped crashing – it started making everything else start to crash. The Bernank calls this “The Price Stability.”
With the US Dollar closing up +2.6% week-over-week (only it’s 5th up week in the last 19 weeks), here’s what The Correlation Risk looked like:
- Euro = DOWN -3.4%
- CRB Commodities Index = DOWN -8.9%
- WTI Crude Oil = DOWN -14.7%
- Gold = DOWN -4.2%
- Copper = DOWN -4.8%
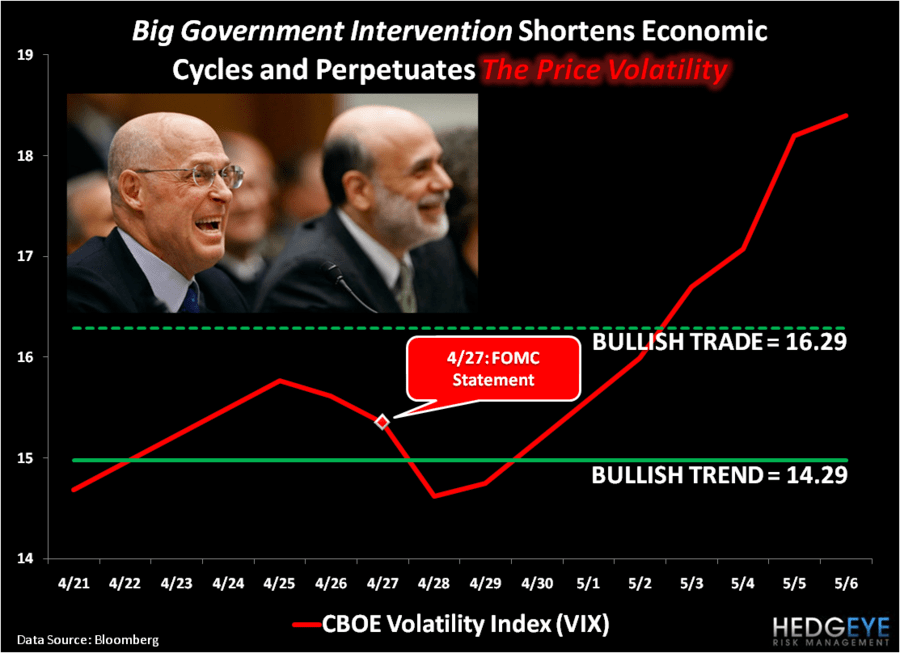
- Volatility (VIX) = UP +24.7%
No, that’s not a typo on the marked-to-market pricing of The Price Volatility associated with The Bernank pandering to the political winds and keeping “hope” for a 3rd round of rule making (QE3) alive.
Now, for myself, The Price Volatility is cool because I’m trying to prove that Big Government Intervention in our markets does nothing but A) shorten economic cycles and B) amplify market volatility.
For our profession and the economy that we live in, it’s not so cool. Last week’s US jobless claims (474,000 – breaking out to the upside) reflect this. So does the weekly Bloomberg consumer confidence survey coming in at minus -46.1. Volatility crushes confidence.
While there is a lot of partisan fanfare about a “bull market in stocks”, I don’t think I have ever seen so much storytelling go alongside a +6.6% YTD return for the SP500 since I started in this business 13 years ago.
Globally, as of Friday’s closing prices, the big “bull market” in equities isn’t especially bullish looking either. Take a look at the Top 3 Global Equity market performers for 2011 YTD:
- Venezuela = +17.6%
- Hungary = +11.2%
- Romania = +10.0%
Go Chavez and the Keynesian Kingdom?
Notwithstanding The Price Volatility that it’s taken us to get to another lower-long-term high in US Equities (down -14.4% versus it’s October 2007 peak), isn’t it interesting that there are only 3 stock markets in the world with double digit returns for the YTD?
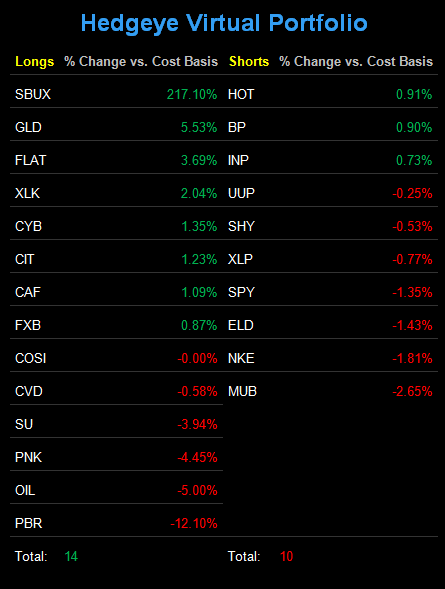
Markets aren’t “free” – at least not like they used to be. And being reminded of that last week is why I took up the Cash position in the Hedgeye Asset Allocation Model on the Bin Laden news. Here are my current asset allocations and positions:
- Cash = 43% (versus 34% last Monday)
- International Currencies = 24% (Chinese Yuan and British Pounds – CYB and FXB)
- Commodities = 12% (Gold and Oil – GLD and OIL)
- Fixed Income = 9% ( US Treasury Flattener – FLAT)
- International Equities = 6% (China – CAF)
- US Equities = 6% (Technology – XLK)
As a reminder, the way I think about asset allocation is the way I think about my own net worth. I’m not saying that’s a perfect methodology for everyone else – I’m just saying it’s the only one I can hold myself accountable to. So after a +98.2% two-year rally in US stocks (where we got bullish in 2009), it shouldn’t be a surprise to see me wait and watch for my spots to get invested again.
We made a call in April of 2010 called “May Showers” that saw The Price Volatility index (VIX) shoot up to 45 by June. Looking ahead at the US political calendar of deficit and debt ceiling debates this June, I’m not especially hurried to be levering myself up alongside my least favorite Fiat Fools either. I’d rather obey my own risk management laws.
My immediate-term support and resistance line for Gold are $1485 and $1521, respectively. Immediate-term support and resistance for oil are $98.63 and $109.11, and my immediate-term support and resistance lines for the SP500 are now 1333 and 1351, respectively.
Best of luck out there this week,
KM
Keith R. McCullough
Chief Executive Officer