April was a surprisingly strong month, despite only 30 days and it being a seasonal shoulder month between March and May. MPEL was the standout.
Total gaming revenue increased 44% YoY to HK$19.9 billion. Certainly, hold played a part as junket volume declined 5.5% from March while total VIP revenue increased 4.4% sequentially. Nevertheless, April was much better than expected. Importantly, high margin Mass increased 31% YoY, putting in the 2nd best Mass month ever, falling only 2% below March 2011.
In terms of market share, MPEL was the big winner, generating 17.2% of the total gaming market, by far its best showing since September 2009. MPEL’s 6 month average share was 14.6%. Most importantly, MPEL was able to grow its mass share significantly, up to 11.2% and 90bps higher than its 6 month average. Overall, MPEL grew its total gaming revenue 91% YoY in April. We still think low hold in March may cause MPEL to disappoint the Q1 whisper EBITDA number of $145 million but the company is certainly off to a great start in Q2.
Wynn was also a market share gainer – 150bps over its 6 months average, driven mostly by a higher than normal VIP hold percentage. Mass market share actually declined. LVS’s share held steady relative to its average but Mass share continues to trend below its moving average. Market share losers were SJM and Galaxy (low hold). While MGM’s share was consistent, the property led the market in growth with total gaming revenue up 128%.
Y-o-Y Table Revenue Observations:
Total table revenues grew 45% YoY this month despite a difficult comp of 73% YoY growth in April 2010, with Mass growth of 31% and VIP growth of 50%. Junket RC also grew 50% in April.
LVS table revenues grew 13% - the slowest of the concessionaires
- Sands was up 19%, driven by a 23% increase in VIP and a 12% increase in Mass
- Sands benefited from high hold this month. Adjusted for 10% direct play (in-line with 1Q11), hold was about 3.6%, compared to 3.2% hold in April 2010, assuming a 14% direct play estimate (in-line with 2Q10). Junket RC was up 18.5%.
- Venetian was up 28%, driven by a 12% increase in Mass and 39% increase in VIP
- Junket VIP RC increased 82%, compared to a 23% decline in April 2010. Assuming 19% direct play, in-line with 1Q11, we estimate that hold was 2.8%, compared to 3.4% hold in April 2010 (assuming 24% direct play).
- Four Seasons was down 43% driven by 61% decline in VIP which was somewhat offset by 76% Mass growth
- The decline that FS experienced in April is partly due to difficult hold comparisons and low hold this month
- Assuming 40% direct play, hold was 2.2% compared to an estimated hold of 3.8% in April 2010 assuming direct play levels were in-line with 2Q10 at 50%.
- Junket VIP RC decreased 15%.
Wynn table revenues were up 71%
- Mass was up 53% and VIP increased 75%
- Junket RC increased 58%
- Assuming 10% of total VIP play was direct, we estimate that hold was 3.4% compared to 3.1% last year (assuming 11% direct play)
MPEL table revenues grew 97%, driven by Mass growth of 62% and VIP growth of 104%
- Altira was up 42% with Mass continuing its tear, up 73% while VIP grew 41%
- VIP RC was up 25%
- We estimate that hold was 3.4% compared to 3.0% last year.
- CoD table revenue was up 149%, driven by 60% growth in Mass and 189% growth in VIP (the most of any property in Macau)
- Junket VIP RC grew 81%
- Massive VIP growth was due to very easy April 2010 comps and very strong RC growth. Assuming 19% direct play, hold was 2.9% compared to 1.9% in April 2010, assuming 18% direct play (in-line with 2Q2010)
SJM revs grew 28%
- Mass was up 22% and VIP was up 31%
- Junket RC was up 41%
Galaxy table revenue was up 15%, driven by 65% growth in Mass and VIP growth of 11%
- Starworld table revenues grew 25%, driven by 104% growth in Mass and 21% growth in VIP
- Junket RC grew 34% at Galaxy Group and 35% at Starworld
MGM table revenue was up the most in April, growing 131%
- Mass revenue growth was 61%, while VIP grew 157%
- Junket rolling chip growth also grew the fastest at 117%
Assuming direct play levels of 10%, we estimate that hold was 3.1% this month vs. 2.6% in April 2010
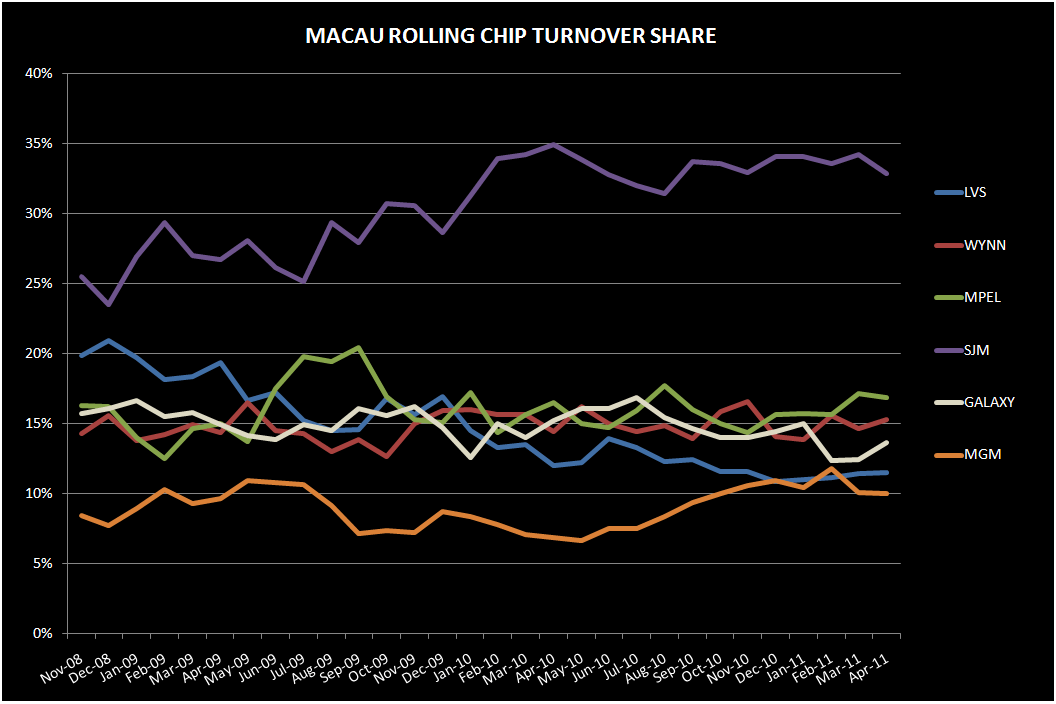
Sequential Market Share (property specific details are for table share while company-wide statistics are calculated on total GGR, including slots):
LVS share rose 1.2% in April to 16.9% from 15.6% in March. This compares to 6 month trailing market share of 17.1% and 2010 average share of 19.5%
- Sands' share increased 90bps to 5.7% off of the properties all-time low share in March
- The decrease was driven by a 120bps increase in VIP market share to 5%, off of an all-time property low in March. RC share was 3.9%, down 30bps sequentially, and below the 2010 average of 4.5%.
- Mass market share ticked down 10bps sequentially to 7.9%
- Venetian’s bounced 1.3% to 9.3% share off of March's all-time lows
- VIP share increased 1.9% to 7.9%
- Junket RC increased 90bps to 6.7%, which compares to an average of 6.3% share in 2010. Perhaps they are making some inroads with their junket strategy?
- Mass share decreased 30bps to 13.8% hitting an all time low for the property. 2010 average share was 15.9% and 6 month trailing share (ex. April) is 15.2% for the property
- FS share decreased 110bps to 1.4%
- VIP share decreased 160bps to 1.1%
- Mass share increased 70bps to 2.5%, the property's 2nd best share month after December 2008
- Junket RC share decreased 60bps to 0.9%, the property’s lowest share since July 2009
WYNN was a big share gainer in April, with share up 2.7% to 16.8%, driven by a combination of high VIP hold and easy sequential hold comps, and above market growth in both Mass and Junket RC. April’s share is above Wynn’s 6 month trailing average share (ex April) of 15.3% and 2010 average share of 14.9%.
- Mass market share decreased 1% to 10.9%, compared to an average of 10.1% in 2010
- VIP market share increased 4.6% to 18.4% sequentially, nicely above its 2010 average of 16.0%
- Junket RC share increased 60bps to 15.3%, in-line with Wynn’s 2010 average of 15.2%
MPEL was the largest share gainer in April, with market share increasing to 17.2% from 14.1% in March – beating out LVS for 2nd place behind SJM! April’s share compares with an average 6 month trailing and 2010 share of 14.6%
- Altira’s share increased 80bps to 6.0%, compared to 5.6% average share in 2010
- CoD’s share increased 2.4% sequentially to 11% - 180bps above Venetian’s table market share!
- Mass market share increased 1.7% to 9.7%, the properties’ second best share after February's all-time high of 10.3%
- VIP market share decreased 2.5% to 11.4% while Junket RC share decreased 40bps sequentially to 10% (compared with 6.7% share for Venetian).
SJM went from the biggest share gainer in March to the biggest loser in April. SJM’s share fell 4.3% to 29.6%. April share compares with an average share of 31.3% in 2010 and a 6 month trailing average of 31.6% (ex April)
- Mass market share decreased 70bps to 40.1% while VIP share plummeted by 5.4% to 27.4%
- Junket RC share decreased to 32.8% from 34.2% in March
In a reversal of last month’s trend, Galaxy was the 2nd largest share loser in April, with share declining to 9% from 11.4% in March. April share compares with an average share of 10.9% in 2010 and a 6 month trailing average of 10.3% (ex April)
- Starworld's market declined 1.4% to 8.2%
- Share gains were entirely driven by VIP which lost 2% share to 9.8% despite Junket RC share increasing 80bps to 11.7%.
- Most of Galaxy’s share losses were caused by low hold, which we estimate was below 2.5% in April compared to 3.1% in March
MGM's share decreased 50bps to 10.5%, from 11% in March. April share compares with an average share of 8.8% in 2010 and a 6 month trailing average of 11.2% (ex April)
- Mass share increased 60bps to 8.9% - the 3rd highest property share after Venetian and CoD
- VIP share decreased 70bps to 10.8% - the 2nd highest property share (that we track) after CoD
- Junket RC decreased 10bps to 10%,but remained above the property’s 2010 average of 8.4%
Slot Revenue:
Slot revenue grew 32% YoY in April to $108MM
- MGM slot revenues grew the most at 94% reaching $15MM
- At 39% YoY, LVS had the second best growth, impressive given the large base. Slot revenues were $32MM.
- Galaxy grew 37% to $3MM
- Wynn’s slot revenue grew 31% reaching $20MM
- MPEL’s slot revenues grew 28% reaching $23MM – in-line with March’s all-time high for the company
- SJM was the only concessionaire to experience a decline in slot growth. SJM slot revenue fell 5% to $15MM.