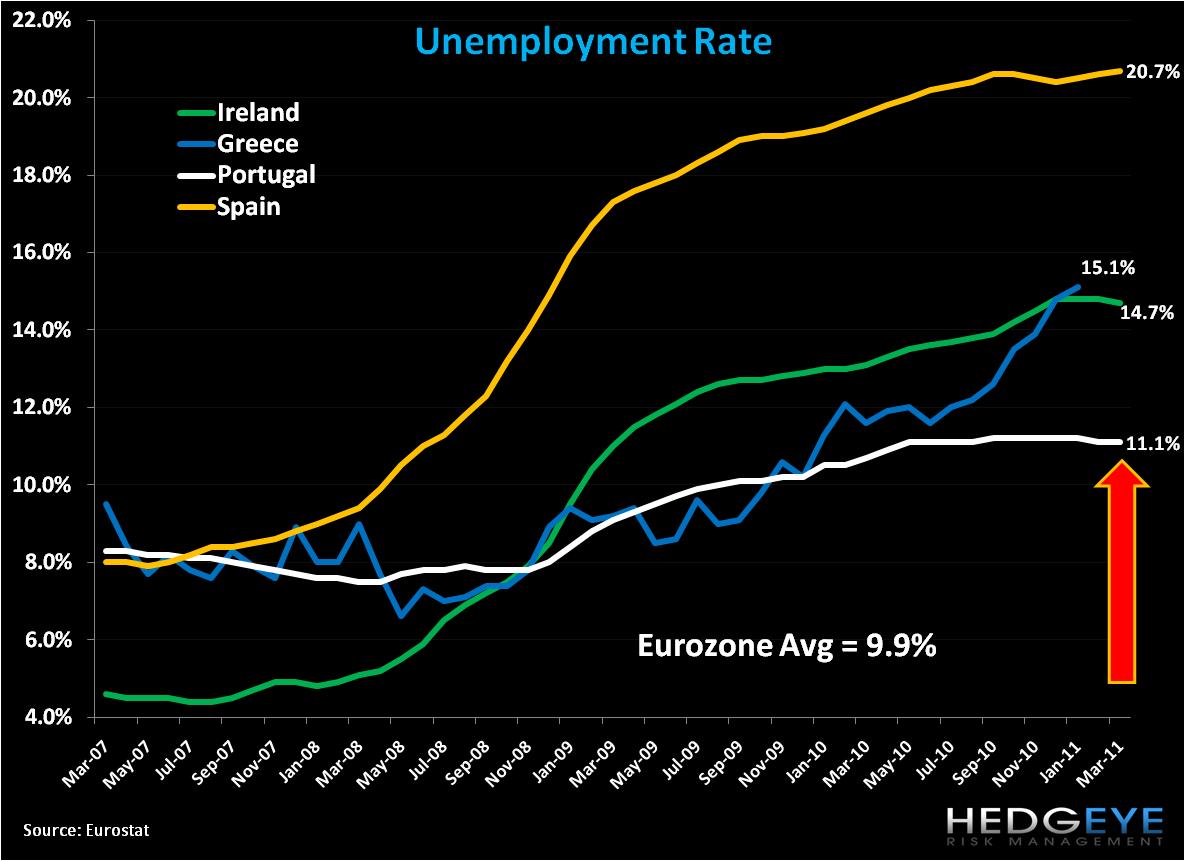
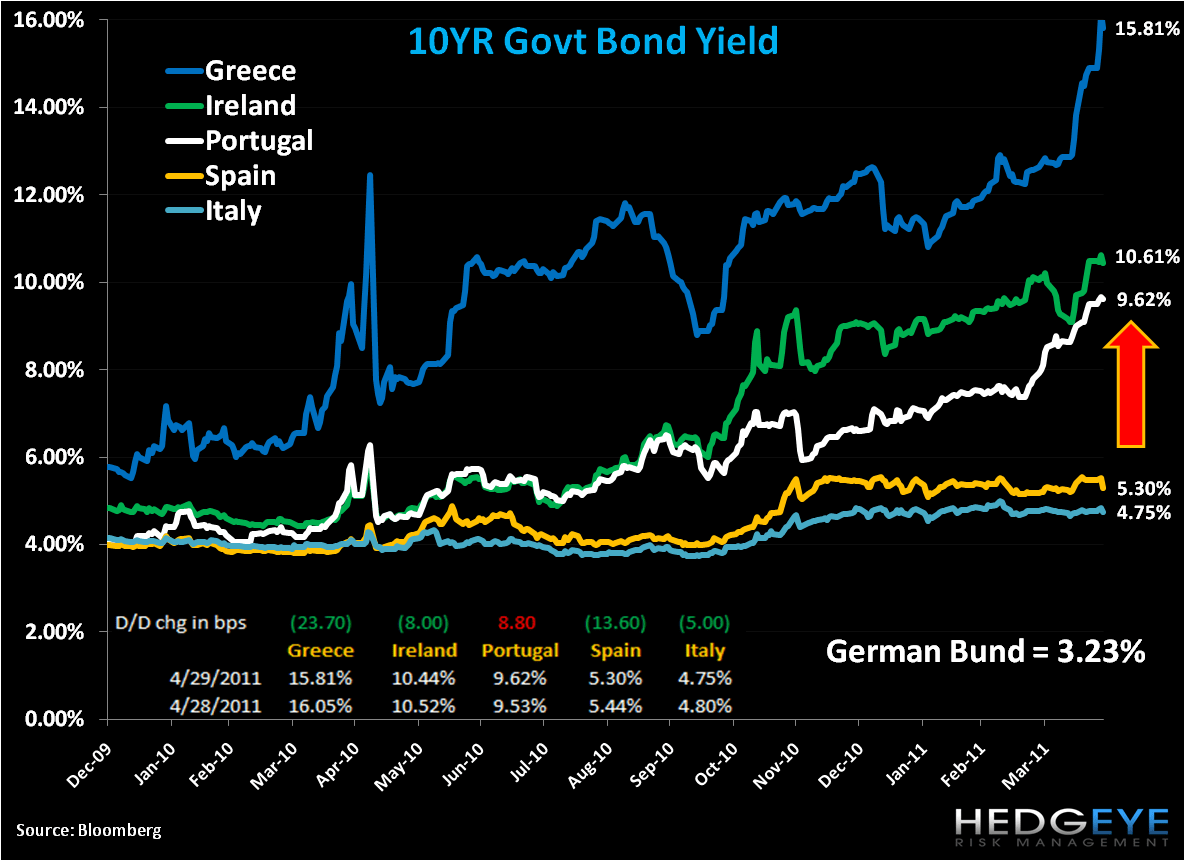
With a tip of the hat to economist Arthur Okun, who created the misery index which assumes that higher rates of unemployment and worsening inflation create more miserable economic and social costs for a country, below we show the three fundamental drivers of unemployment, inflation (CPI), and government bond yields across the Eurozone’s periphery. The main take-away that we continue to hammer on is that piling debt upon debt with inflation and unemployment rising is a recipe for disaster, or misery, as it perpetuates and extends slow to negative growth and inhibits government revenues to pay off grossly imbalanced budgets, essential requiring governments to take outside assistance. Over the intermediate term we expect the red arrows in the charts to push misery higher.
Matthew Hedrick
Analyst