The guest commentary below was written by written by Mike Green. This piece does not necessarily reflect the opinions of Hedgeye.

“A study on aging by a sociologist at the University of Chicago found that happiness levels tended to rise rather than fall with old age. One of the main reasons cited? Lower expectations and more acceptance of the way things were.” – Dr. Sheri Jacobson
What happens when we set expectations too high? As a parent of high-achieving children, I can tell you that it’s a fine Goldilocks line between too high, too low, and just right. I’m skeptical that I found the right line; all of my children experienced more stress than they probably should have.
But raising children and managing portfolios with an eye towards meeting retirement objectives are two very different activities. The first has been done for millennia, while the second is a uniquely 20th-century innovation. We have apocryphal examples of “the permanent portfolio” attributed to Jakob Fugger from 1525, updated for the modern era by Harry Browne, and the Solomon Portfolio popularized by Robert Katz, but these are rudimentary at best.
We have the age-dependent portfolios of John Bogle, roughly proxied as “your age in bonds,” which is most commonly expressed as the Target Date Funds that dominate our retirement landscape today. If you’re unfamiliar with Target Date Funds, they were created in the early 1990s by Wells Fargo Investment Advisors to provide a “managed” life cycle portfolio by following a “glidepath” that de-risks the portfolio as the investor ages. Quoting Wikipedia, “The theoretical underpinnings to glidepath design are based on combining modern portfolio theory, with the theory of ‘human capital’ and the present value of expected future earnings.”
I have a number of issues with the construction of these vehicles. For example, while many investors react with horror at the “aggressive” nature of many target date funds in their early stages, when they are often 95% in equities, I feel compelled to point out that these are actually nearly riskless allocations in their early stages as the cash contributions dominate the equity volatility. In fact, the low volatility of these strategies early in their accumulation phase helps to explain the vol-seeking behavior of young investors in assets like crypto.
But the much bigger issue with these strategies is their over-reliance on historical return expectations. For example, if we go to Vanguard’s “retirement nest egg calculator,” we can run a Monte Carlo simulation to estimate the return of a portfolio composed of equities, bonds, and cash. By manipulating the initial portfolio, we can isolate the “expected” return to each asset class:

If we run equities at 100%, we get a portfolio return of equities under the scenario analysis. With a starting value of $10MM, and de minimus spending of $1,000 per year, we get the “expected” value of the equity investments as 50% of outcomes between $18-$42MM from $10MM over 10 years.
(18/10)^(1/10)=6.1%
(42/10)^(1/10)=15.4%.
So according to Vanguard, 50% of outcomes for equities are between 6.1% and 15.4% over the next decade, with an expected value of 11%. This, of course, is exactly the S&P 500’s ARITHMETIC return over the last 100 years.

A similar exercise for bonds return 4.5-7.1% per year. A number that potentially makes sense today, but is unchanged from where this same calculator projected them two years ago.
In contrast, I ran a Twitter poll to ask for the same expectations:


Here the expected returns are 6.3% and 4.6% respectively. So the bond expectations seem reasonable, but certainly, versus the FinTwitterati expectations (perhaps not representative of investors, but certainly feels like a reasonable sample), the equity expectations border on the absurd. Does this matter?
Yes, it certainly does. Because the single largest inflow into US equity markets comes from money flowing into retirement accounts, and the single largest pool of those assets now come in the form of Target Date funds. Over the past decade, Target Date Funds have risen from roughly 17% of defined contribution plan assets to nearly 40%. (Note the following slides are all drawn from Vanguard’s excellent “How America Saves” series of reports)
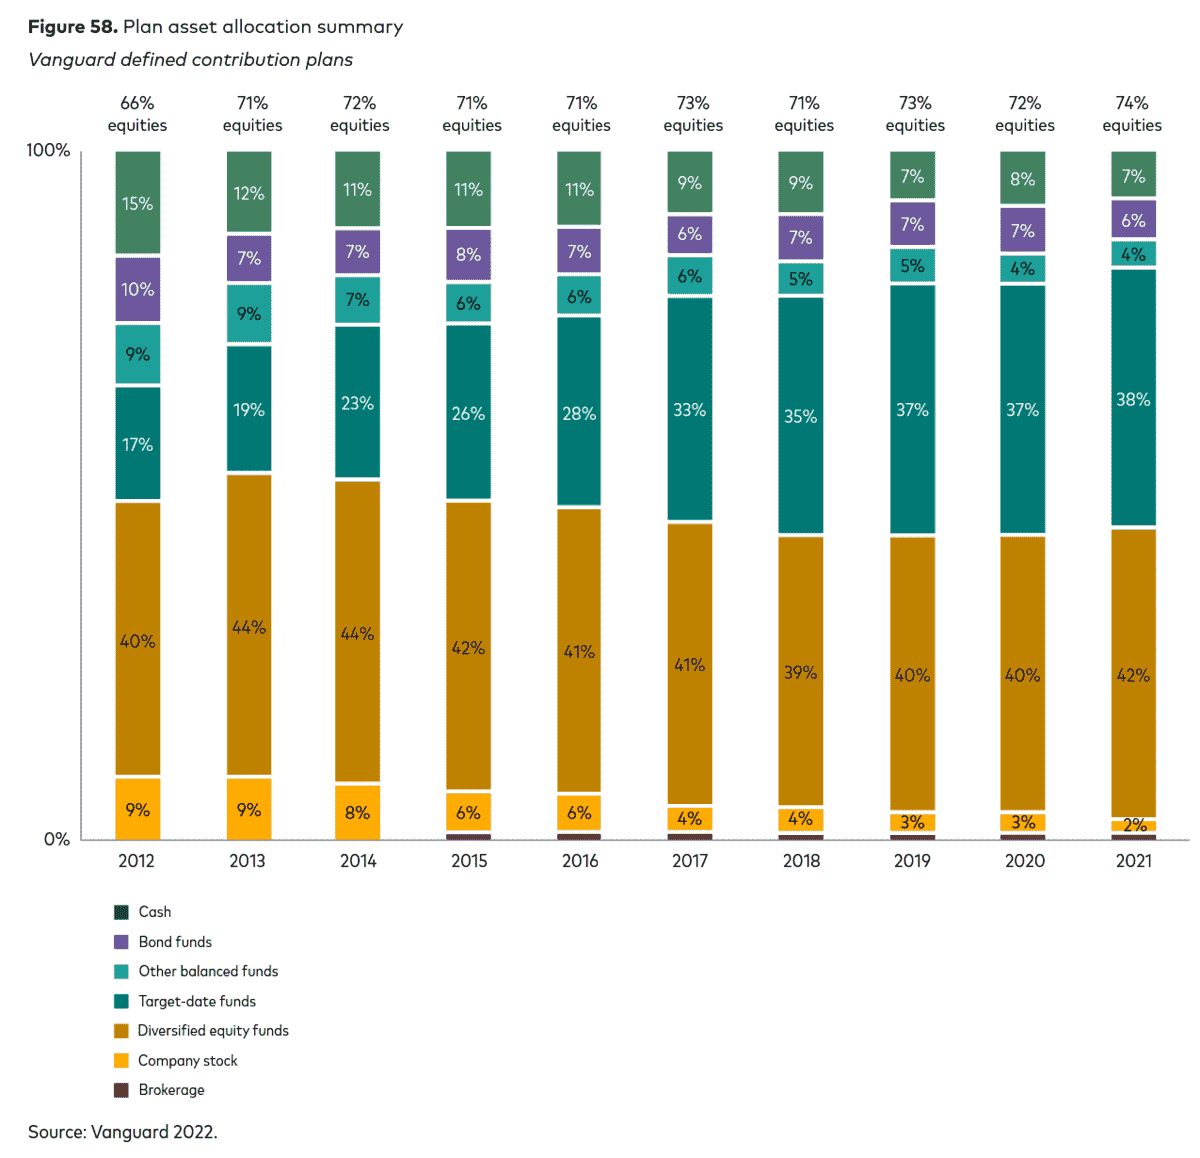
But that’s not the real kicker. The really important number is the percentage of contributions (new flows). Target Date Funds now capture over 60% of all new assets. In other words, the majority of assets no longer CARE what valuations (or bond yields) look like when allocating to assets.

The other feature of Target Date Funds is that they are not open to competition. Once a plan sponsor selects a provider of Target Date Funds, these funds select their internal funds to sub-advise the equity and bond allocations. In other words, they are bundled.
Has anyone been harmed? Beyond the obvious harm to competition from bundling, I would argue we all have been harmed because the growth of these strategies has had a pernicious effect on markets by disrupting supply and demand curves for equities (and bonds). Many of you have seen presentations I’ve given on the topic of passive’s impact on market structure, but the “money shot” resides in the following slides. In 2018, I surveyed investors and asked a question I was a bit surprised had not been previously asked, “How do you respond to inflows or outflows given valuations?” Compiling the responses gave me marginal supply and demand curves for equities. Unsurprisingly, the demand curve to buy declined with rising valuations while the supply curve rose. Most interesting was the intersection of supply and demand at 16x — exactly the market’s historical average valuation. Running these supply and demand curves through an agent-based model where the agents were individually endowed with statistically similar, but not exact, supply and demand curves and then randomly given capital or had it taken away. The results of this model are in the right-hand chart — markets mean revert when market participants expect mean reversion and the center of that distribution is endogenously determined. Note I didn’t ask any questions about the Fed!

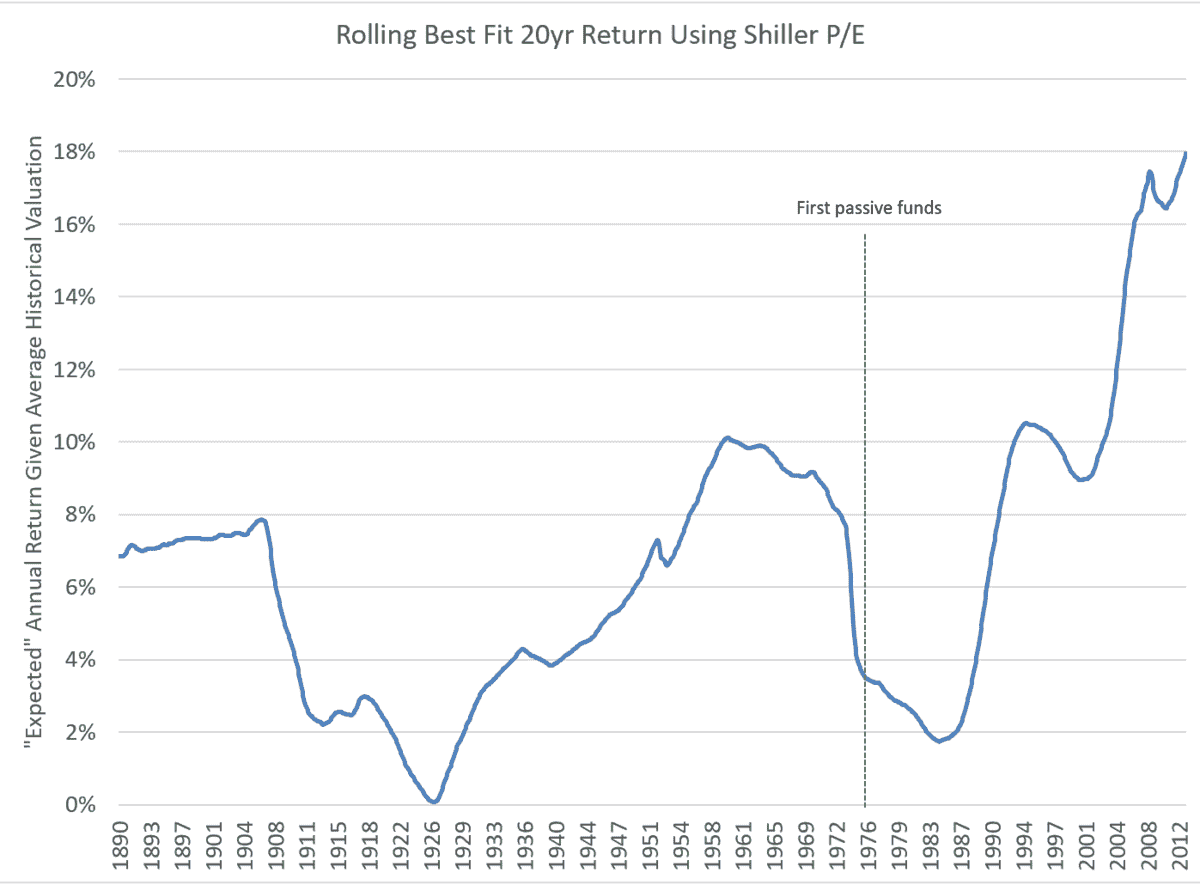
However, something quite different occurs when we introduce passive manager behavior to the model. Remember that passive managers run on a very simple algorithm, “Did you give me cash? If so, then buy. Did you ask for cash? If so, then sell.” There is no consideration of value — in fact, the market cap weighting methodology does the opposite by adding MORE of each marginal flow to the most richly valued stocks while reducing marginal investment in stocks that fall in price. The net effect of passive gaining share is to push the markets away from the historical equilibrium. As valuations are pushed higher, returns are anomalously high for any given valuation.

And unfortunately, this dynamic is exactly what we see when we evaluate the historical record. The “expected” (using a best fit equation) return for any given valuation has risen dramatically versus history:
Now the immediate pushback is that IF this were true, we’d expect lower allocations to equities GIVEN higher valuations by thoughtful market participants who understand that high prices lead to lower expected returns. Warren Buffett, for example:
“It's far better to buy a wonderful business at a fair price than a fair business at a wonderful price” — Warren Buffett
Except remember that the majority — in fact, the VAST majority of fund flows no longer make this calculus. They now seek “market exposure” through passive funds, and in the case of Target Date Funds, the only question is, “How old are you?”:

So we’re left with a market that is now veering wildly off course. Instead of allocations to equities falling with rising valuations, they are rising. Instead of high valuations punishing investors, they are being rewarded for doggedly buying the dip — no matter the dip's valuation.

EDITOR'S NOTE
This is a Hedgeye Guest Contributor note by Michael Green, portfolio manager and chief strategist at Simplify Asset Management. Check out more of Mike's research here. Mike's proprietary research into the shift from actively managed portfolios and investment funds to systematic passive investment strategies has been presented to the Federal Reserve, the BIS, the IMF and numerous other industry groups and associations. Michael joined Simplify in April 2021.
Prior to Simplify, Mike served as portfolio manager and strategist at Logica Capital Advisers, LLC, Thiel Macro and founded Ice Farm Capital, a discretionary global macro hedge fund seeded by Soros Fund Management, and Canyon Capital Advisors, a $23B multi-strategy hedge fund based in Los Angeles, CA. This piece does not necessarily reflect the opinions of Hedgeye.
