New record despite low hold
March was another record month for Macau with total gaming revenues increasing 48% off of a 42% comp. Growth in March was achieved in spite of low market hold. Assuming direct play of 8.7% or RC of $6.1BN, March hold was only 2.60% compared to a hold of 2.67% in March 2010 (assuming 7.0% direct play or $3.1BN). If hold in both periods was 2.85%, March YoY GGR growth would have been up 50%.
Every property that we track appeared to have below normal hold, with the exception of Starworld and MGM. The US operators lost share to their Asian competitors – specifically SJM and Galaxy. MGM experienced its third best market share since opening and should have another good quarter although hold was much lower sequentially. MPEL also had a standout month in March volume-wise but experienced some very bad luck in VIP and we think Mass.
Y-o-Y Table Revenue Observations:
Total table revenues grew 48% YoY this month despite low hold in the month, with Mass growth of 31% and VIP growth of 54%. Junket RC grew 55% in March.
LVS table revenues grew 17%
- Sands was up 10%, driven by a 2% increase in VIP and a 23% increase in Mass
- Despite an easy comp, hold continued to impact Sands for the second month in a row. Junket RC chip grew 19%. Hold, adjusted for 15% direct play (in-line with 4Q10), was about 2.2%, compared to 2.6% hold in March 2010, assuming a 10% direct play estimate (in-line with 4Q09)
- Venetian was up 15%, driven by a 7% increase in Mass and 21% increase in VIP
- Junket VIP RC increased 42%. Assuming 19% direct play, in-line with 4Q10, we estimate that hold was 2.7%, compared to 2.5% hold in March 2010 (assuming 21% direct play).
- Four Seasons was up 41% y-o-y driven by 34% VIP growth and 85% Mass growth
- Junket VIP RC increased 30%. Assuming 50% direct play, hold was 2.5% compared to an estimated hold of 2.7% in March 2010 assuming direct play levels were in-line with 4Q09 at 43%.
Wynn table revenues were up 57%
- Mass was up 59% and VIP increased 57%
- Junket RC increased 45%
- Assuming 11% of total VIP play was direct, we estimate that hold was 2.5% compared to 2.3% last year (assuming 10% direct play)
MPEL table revenues grew 58%, driven by Mass growth of 59% and VIP growth of 42%
- Altira was up 45%, with Mass continuing its tear, up 71% while VIP grew 43%
- VIP RC was up 25%
- Hold comparisons were easy in March. We estimate that hold was 2.7% compared to 2.3% last year.
- CoD table revenue was up 70%, driven by 38% growth in Mass and 82% growth in VIP
- Junket VIP RC grew 122% - more than any other property in Macau. However, bad luck heavily impacted results - despite easy comps. March 2010 hold was 2.5% (assuming 15.2% direct play) vs. 1.9% this month, assuming 18.5% direct play (compared to 19% in 4Q2010)
SJM revs grew 46%
- Mass was up 28% and VIP was up 55%
- Junket RC was up 55%
Galaxy table revenue was up 46%, driven by 39% growth in Mass and VIP growth of 47%
- Starworld table revenues grew 49%, driven by 26% growth in Mass and 51% growth in VIP
- Junket RC grew 38% at Galaxy Group and 40% at Starworld
- Galaxy was the only concessionaire in March to hold above theoretical levels. We estimate that Galaxy held at 3.14% this month.
MGM table revenue was up the most in March, growing 96%
- Mass revenue growth was 40%, while VIP grew 115%
- Junket rolling chip growth was only second to CoD’s at 121.7%
- Assuming direct play levels of 15%, we estimate that hold was 2.8% this month – in line YoY
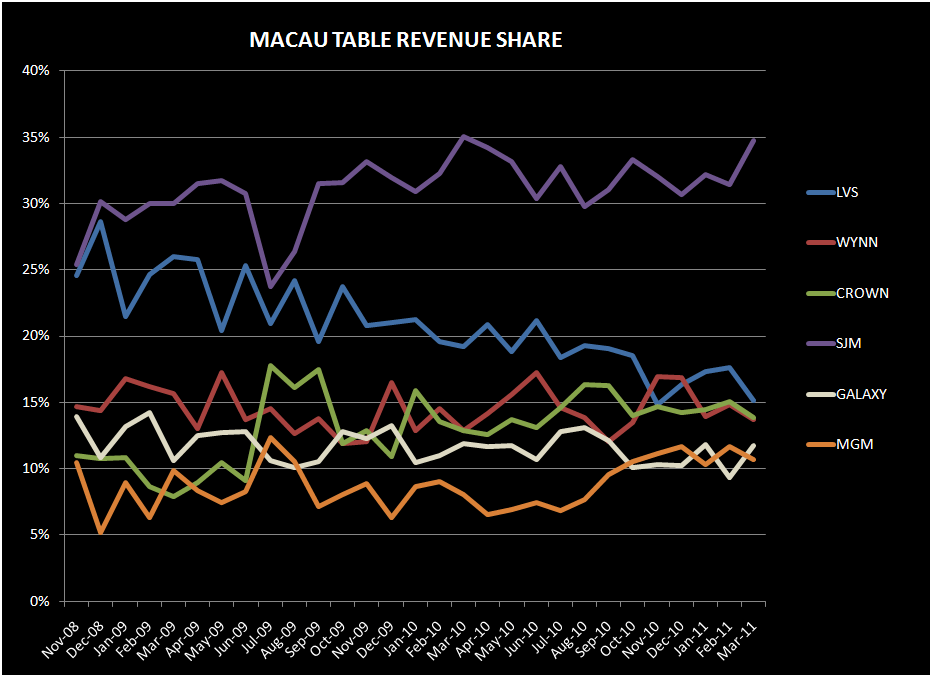
Sequential Market Share (property specific details are for table share while company wide statistics are calculated on total GGR, including slots):
LVS was the biggest share loser in March with share dropping 2.4% to 15.6% from 18.1% in February
- Sands' share decreased 80bps to 4.8% - an all-time low for the property
- The decrease was driven by a 70bps decline in VIP market share to 3.7%, an all-time low for property. RC share was 4.1%, up 10bps sequentially, but below the 2010 average of 4.5%.
- Venetian’s share plunged 2.2% to 7.9% from 10.1% in March – hitting a record low for the property
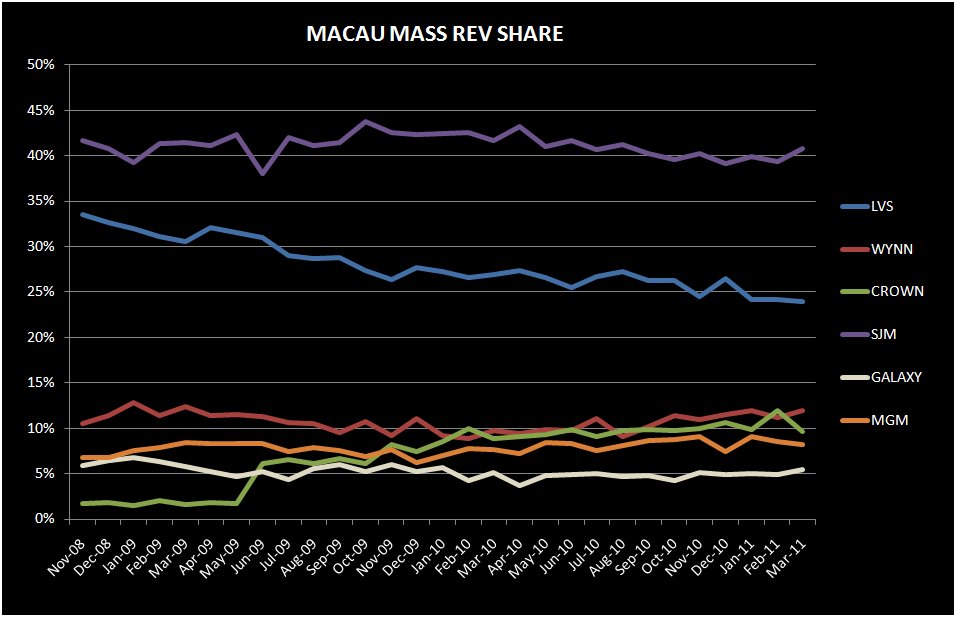
- Mass share decreased 80bps to 14.1% from 14.9% in February (an all-time low for the property)
- VIP share decreased 2.7% to 6.0% - the second worst month for the property after Jan 2011
- Junket RC increased 10bps to 5.8%, which compares to an average of 6.3% share in 2010
- FS share increased 20bps to 2.5%
- VIP share increased 20bps to 2.7%
- Mass share increased 10bps to 1.8%
- Junket RC share increased 10bps to 1.5%
WYNN's share decreased 1.2% to 14.0% from 15.2% in February, driven by a combination of low VIP hold and some share loss in Junket RC
- Mass market share increased 70bps to 11.9%, compared to an average of 10.1% in 2010
- VIP market share decreased 1.6% to 14.3% sequentially, below with its 2010 average of 16.0%
- Junket RC share decreased 90bps to 14.7%, below Wynn’s 2010 average of 15.2%
MPEL's market share decreased to 14.1% from 15.2% in January – beating out Wynn by 10bps for 3rd place
- Altira’s share increased 10bps to 5.2%
- CoD’s share decreased 1.3% sequentially to 8.7% - 80bps above Venetian’s table market share!
- Mass market share decreased 2.2% to 8.1%, lower than February's all-time high of 10.3%
- VIP market share decreased 1.0% to 8.9% while Junket RC share increased 1.6% sequentially to 10.4% (compared with 5.8% share for Venetian).
SJM was the largest share gainer this month with total GGR jumping to 33.8% up from 30.6% in February. This was SJM’s best share month since April 2010.
- Mass market share increased 1.5% to 40.8% while VIP share increased 3.8% to 32.8% (SJM’s best share in 40 months)
- Junket RC share increased to 34.2% from 33.6% in February
Galaxy was the other big share gainer in March – gaining back its February losses (-2.3%) to 11.4% share
- Starworld's market share jumped 2.5% to 9.6%
- Share gains were largely VIP driven
MGM's share decreased 80bps to 11.0%, from 11.8% in February
- Mass share decreased 30bps to 8.2%
- VIP share decreased 1.2% to 11.5% from 12.7% in February
- Junket RC decreased 2.0% to 10.1%, above the property’s 2010 average of 8.4%
Slot Revenue:
Slot revenue grew 42.5% YoY in March to $118MM, just $2MM below February’s record month
- MGM slot revenues grew the most at 109% reaching $19MM – a record for the property
- At 74% YoY, Galaxy had the second best growth – granted, on a very small base. March slot revenue reached $4MM.
- SJM grew 61% to $19MM
- Wynn’s slot revenue grew 46% YoY reaching $24MM – the second best month for the property following a record February
- MPEL’s slot revenues grew 37% reaching $23MM – setting an all-time high for the company
- LVS had the slowest slot growth at 10%, granted off of the highest base. Slot revenues were $30MM.