This week's notable callouts include European bank and sovereign swaps tightening and the 2-10 spread tightening.
Financial Risk Monitor Summary (Across 3 Durations):
- Short-term (WoW): Neutral/ 4 of 11 improved / 4 out of 11 worsened / 3 of 11 unchanged
- Intermediate-term (MoM): Negative/ 3 of 11 improved / 5 of 11 worsened / 3 of 11 unchanged
- Long-term (150 DMA): Positive / 5 of 11 improved / 4 of 11 worsened / 2 of 11 unchanged

1. US Financials CDS Monitor – Swaps were mixed across domestic financials, widening for 16 of the 28 reference entities and tightening for 12.
Tightened the most vs last week: JPM, WFC, BAC
Widened the most vs last week: RDN, PRU, HIG
Tightened the most vs last month: UNM, MMC, WFC
Widened the most vs last month: RDN, MET, XL

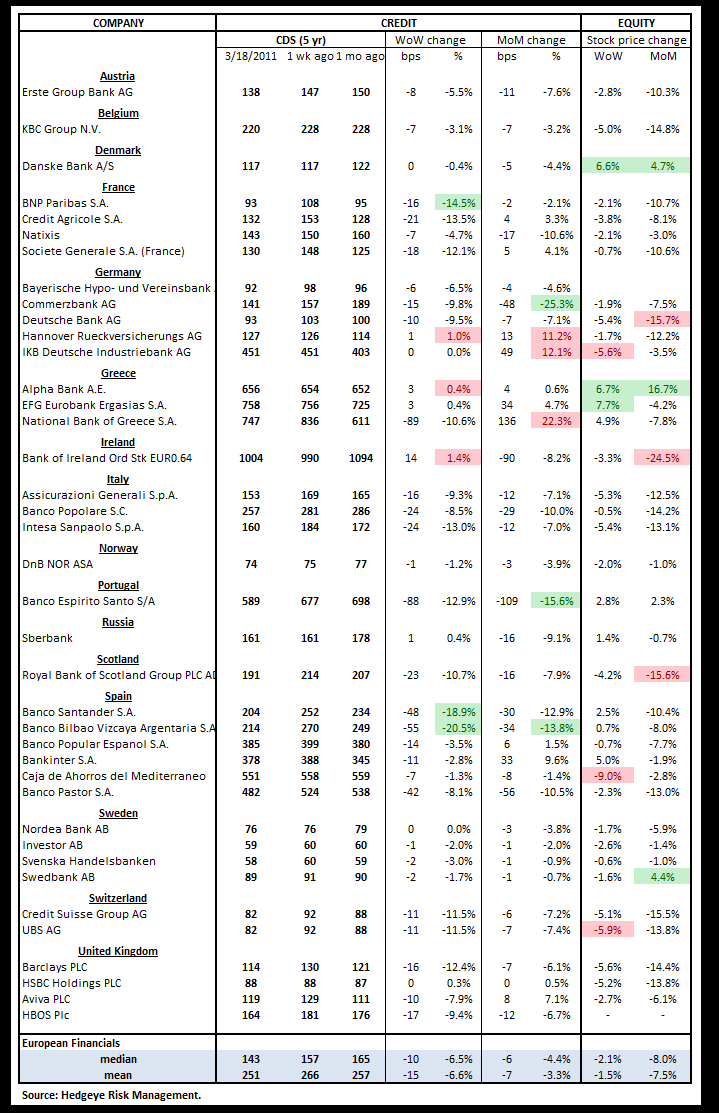
2. European Financials CDS Monitor – Banks swaps in Europe were mostly tighter, tightening for 32 of the 39 reference entities and widening for 7.
3. Sovereign CDS – Sovereign CDS tightened across Europe, falling 33 bps on average last week as Greece backed off its highs.

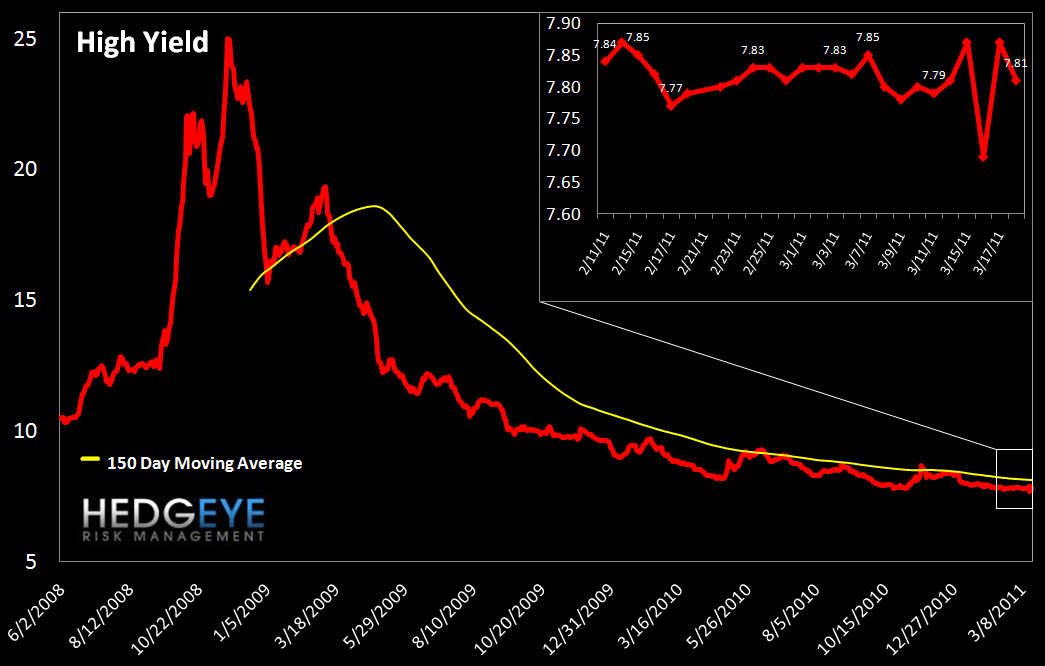
4. High Yield (YTM) Monitor – High Yield rates rose slightly last week, ending at 7.81, 2 bps higher than the previous week.
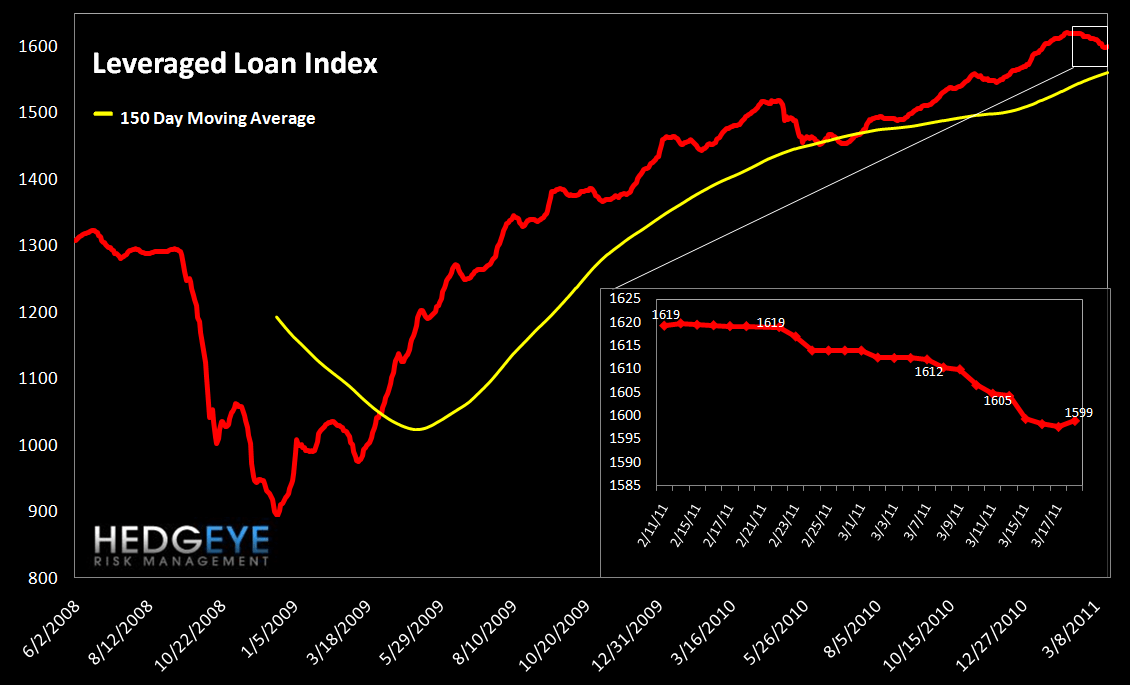
5. Leveraged Loan Index Monitor – The Leveraged Loan Index fell last week to end the week at 1599.
6. TED Spread Monitor – The TED spread hit the highest level since last August, ending the week at 23.7 versus 23.2 the prior week.

7. Journal of Commerce Commodity Price Index – Last week, the JOC index hit its lowest level since January, the rose to end the week 1 point down from its prior level at 27.5.

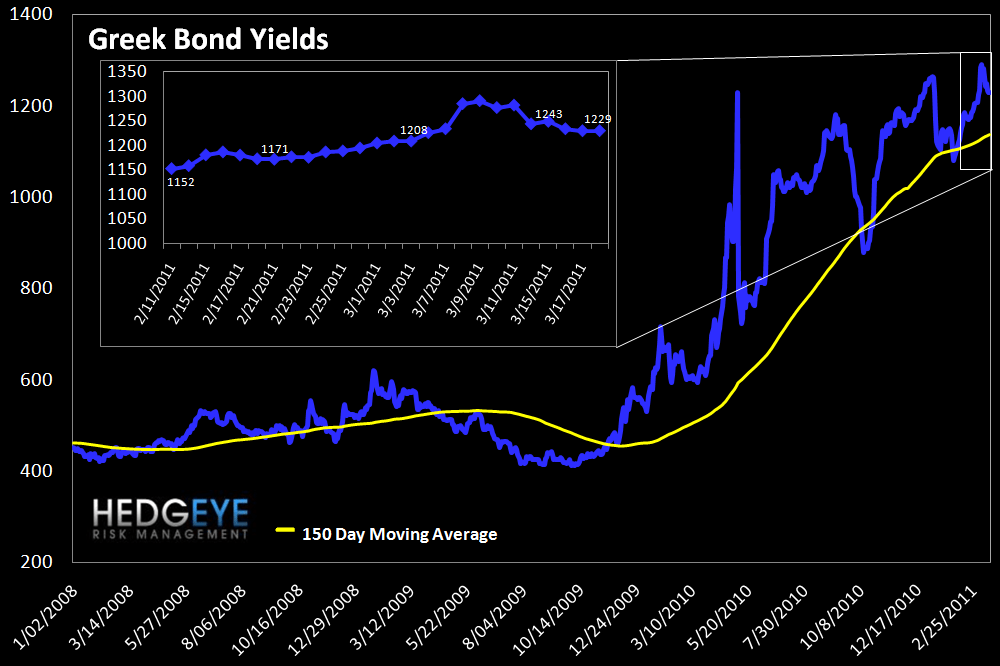
8. Greek Bond Yields Monitor – We chart the 10-year yield on Greek bonds. Last week yields fell 52 bps.
9. Markit MCDX Index Monitor – The Markit MCDX is a measure of municipal credit default swaps. We believe this index is a useful indicator of pressure in state and local governments. Markit publishes index values daily on four 5-year tenor baskets including 50 reference entities each. Each basket includes a diversified pool of revenue and GO bonds from a broad array of states. Our index is the average of their four indices. Spreads fell last week, closing at 131 on Friday.

10. Baltic Dry Index – The Baltic Dry Index measures international shipping rates of dry bulk cargo, mostly commodities used for industrial production. Higher demand for such goods, as manifested in higher shipping rates, indicates economic expansion. Early in the year, Australian floods and oversupply pressured the Index, driving it down 30%. Since then it has bounced off the lows and is now steadily climbing. Last week it rose 216 points to 1346.

11. 2-10 Spread – We track the 2-10 spread as a proxy for bank margins. Last week the 2-10 spread tightened slightly to 276 bps.

12. XLF Macro Quantitative Setup – Our Macro team sees the setup in the XLF as follows: 2.1% upside to TRADE resistance, 3.0% downside to TRADE support.

Joshua Steiner, CFA
Allison Kaptur
