The guest commentary below was written by Harley Bassman (aka Convexity Maven) Managing Partner at Simplify. This piece does not necessarily reflect the opinions of Hedgeye.

Quipped my good friend and ex-Merrill Lynch sparring partner David Rosenberg: “Cycles die; and you know how they die ? The Fed puts a bullet in its forehead.”
Last month I penned “Soft Landing” – September 7, 2022; and if you printed out a hard copy, my advice is to repurpose it to line your bird cage.
Federal Reserve (FED) Chair Jerome Powell clearly stated at his September 21 post-meeting press conference that their policy rate was headed to 4.60% sometime early next year unless inflation materially declined, which is unlikely to occur due to its lagging component structure.
The pressing question is which breaks first: the Bond market, the Stock market, the Housing market, or the Economy via rising unemployment.
As detailed previously, political shenanigans delayed Mr. Powell’s confirmation, paralyzing the FED in the summer of 2021 when Consumer Price Inflation (CPI) was already cooking at 5.4%.
The FED tried to paper over the delay in raising its policy rate by asserting (perhaps sincerely) that this inflation was “transitory”. Painfully chagrinned, they finally lifted rates in March 2022 when CPI had reached 7.9%.
To affirm its credibility and Mr. Powell’s legacy, the FED has indicated they will continue to raise rates until inflation meaningfully descends to its 2.0% “target rate”, notwithstanding that CPI is a lagging indicator.
With “transitory” becoming a dirty word, the FED has (temporarily) lost the ability to conduct policy based upon its projections, no matter its confidence. Thus, they are handcuffed to -boghafrois line- “headline” inflation, which cannot decline quickly enough to stave off further policy tightening.

I shed no tears for the embarrassment of Team Transitory who vociferously insisted that the FED was not printing money, and that inflation was the result of short-term imbalances that would quickly correct.
However, I do have some sympathy for the FED who, despite claiming independence, are still an arm of the Government trying to balance competing interests.
No matter, the FED has effectively purchased a berth on the Titanic after it hit the iceberg. Mr. Powell is conducting the band while the market is sending up rescue flares and we all wonder who will find a lifeboat.
The –gorm line- MOVE Index was the first to sniff out trouble as it has tripled to the 150s after bottoming in the low 50s in September 2021.
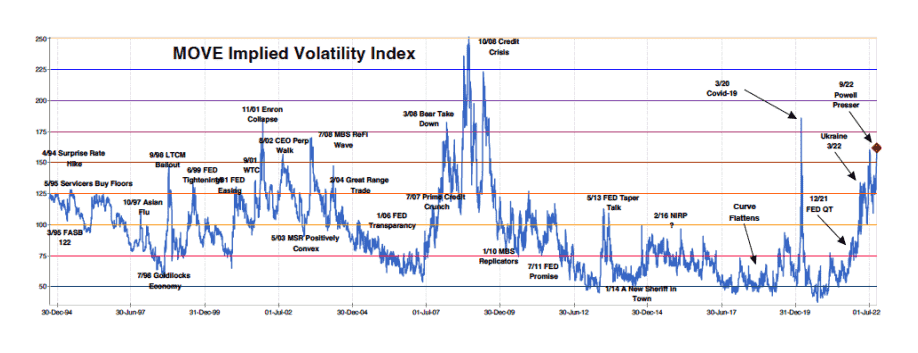
As the creator of this Index, let me say that both 50 and 150 are the “wrong number”. A level near 50 can only occur when the FED actively constrains risk, while a level near 150 occurs when the FED has lost control.
The MOVE at 150 infers interest rate changes of about 9.5bps per day, a volatility that is unsustainable if only because human beings cannot tolerate such stress for long periods of time.
Much has been written about the clairvoyance of the -peitseagan line- Yield Curve, a popular version being the spread between the UST two-year and UST ten-year rates, which tends to invert 14 months before a -dubhar bar- recession.
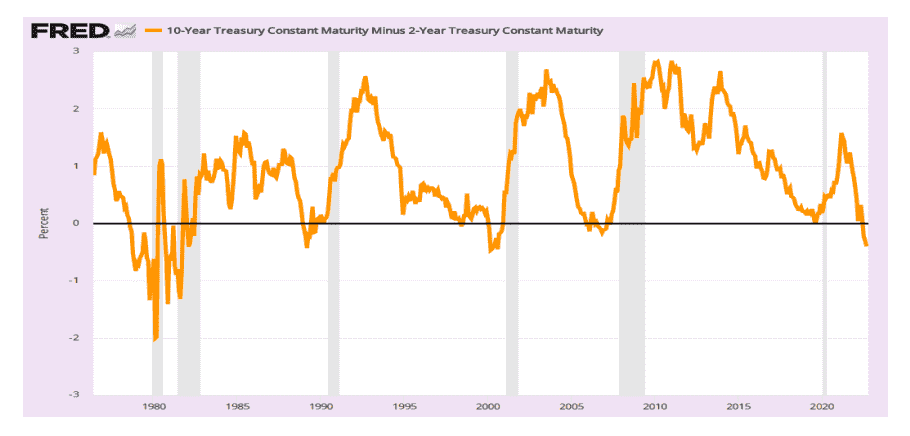
As such, there is the case to be made that a recession is not due any earlier than Q2-2023; and thus, FED policy is presently not too aggressive
However, the -uaine line- spread between the five-year and thirty-year swap rates is not nearly as sanguine – in fact, it is screaming: Panic!!
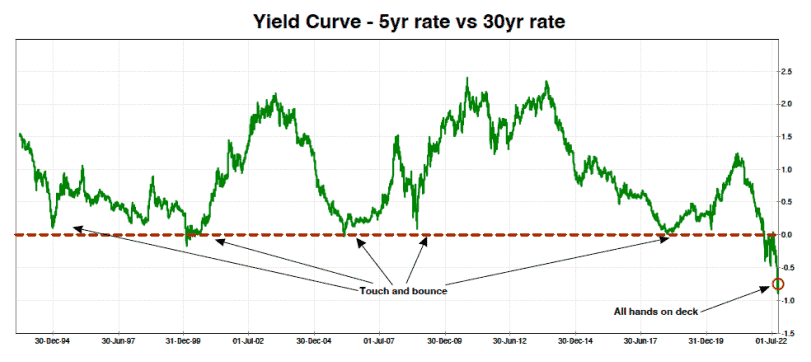
This spread has rarely breached zero over the past thirty years, yet last month it touched NEGATIVE 90. [Note: There are a few technicalities that make this not quite an apples-to-apples comparison over time, but trust me, these blips are not worth 90bps]
One of my favorite indicators is the relationship between the -meirgeadh line- FED Funds rate and the -aol line- five year forward five-year rate; the FED soon cuts rates after they touch.
With a 5yr-5yr rate near 3.50%, there might only be one more hike ahead; as such, an indicated rate target of near 4.60% would be a massive policy mistake that could have rather dire financial and economic consequences.

To be clear, I am NOT predicting a 1987 style stock market crash; but stocks will not find a bottom until sometime near the end of the hiking cycle.
Our banking system is in terrific condition with ample reserves. Moreover, there will NOT be a repeat of a 2007/08 housing collapse since post-GFC regulations require mortgage lenders to affirm that the borrower has sufficient income.
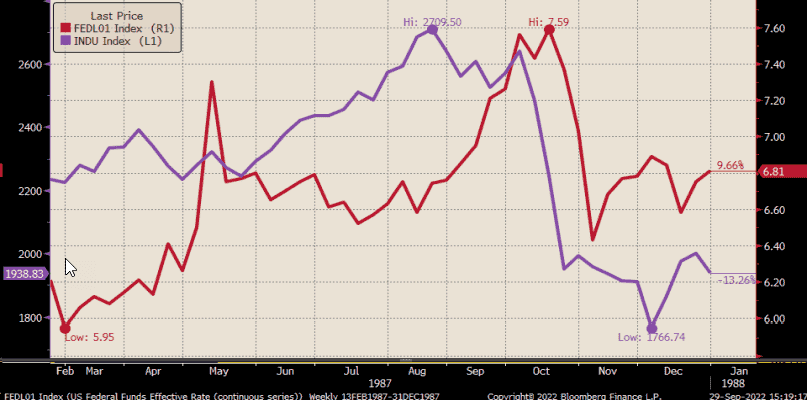
But let’s not forget the -purpaidh line- stock market impact in 1987 when the FED hiked their -aireimh line- Funds rate from 6.0% to 7.5% with inflation barely above 4.0%.
The infamous practice of “portfolio insurance” accelerated the speed, but it was the ten-year rate advancing from 7.0% in January 1987 to 10.25% in October that ultimately broke the market. (Yes….I was on the Merrill Lynch trading floor when it happened; rather surreal.)
Beyond the Yield Curve, other markets are showing signs of extreme stress. My favorite -guma line- measure of Mortgage bond value has reached levels only visited during the GFC and COVID; and remember, MBS have no credit risk.
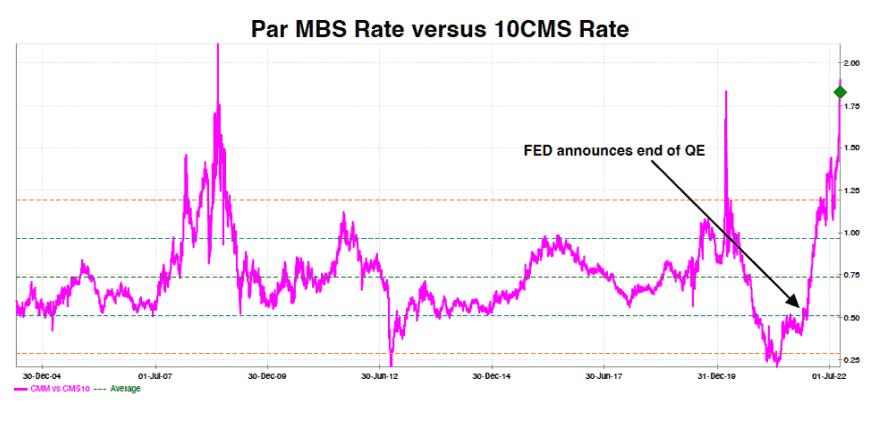
And not to be too wonky, but the MBS risk profile has improved since they are less -lion line- negatively convex, thus they are easier to manage in a portfolio.

Some pundits are noting that -cal line- Investment Grade (IG) credit spreads have widened by 50bps to near 100bps, indicating stress in the system.

Perhaps true, but more importantly, the -uisge line- full cost to borrow for IG firms has exploded from 1.00% to 5.00% (five-year interest rate plus spread). This will slam the brakes on growth as well as trim profits and stock buy-backs.

What will break first is still unclear as these sorts of events tend to be a surprise, notwithstanding the obvious signals. A taste of this occurred last month when the UK bond market broke hard.
The Bank of England (BOE) had to step in buy “unlimited securities” to save their $1.8Tn pension system that was over exposed to derivative margin calls.
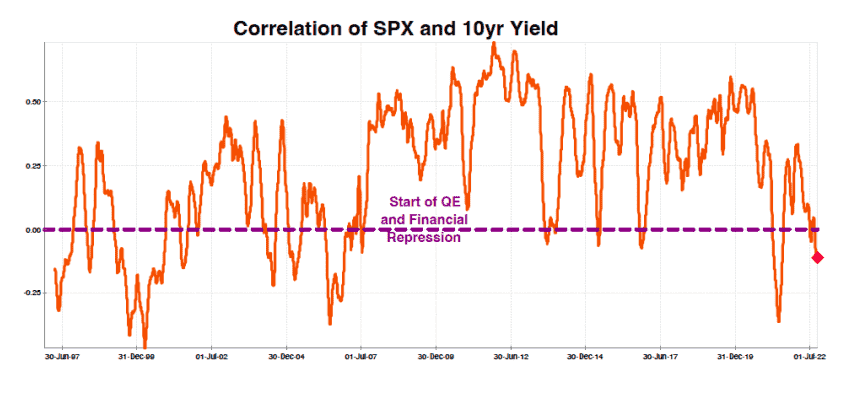
I have warned that rising rates might break the -orains line- correlation between Stock prices and Bond yields, the cornerstone of the 60/40 portfolio. Since the start of the year, the SPX is down 23% while core Bonds are 15% lower.
The big enchilada is the housing market.
While there will not be a GFC style crash in home prices or bank stocks, the business of buying and selling homes is about to come to a screeching halt; this is the market sector the FED is going to break. [Actually, it is already busted !!]
When the retail mortgage rate was 3.00% at the start of the year, one could borrow $450,000 for thirty-years with a monthly payment of $1,900. That is 28% of the near median income of $82,000.
With the retail mortgage rate now at 6.50%, a $1,900 monthly payment can only finance $300,000. Assuming a constant $50,000 down payment, a house price must decline from $500,000 to $350,000, or 30%, for the same cash flow cost.
It is unlikely house prices will decline by 30% as supply will be scarce. Home owners who locked in a 3.00% rate cannot afford to move to a new house with a 6.50% mortgage; and better credit borrowers will offer few default sales.
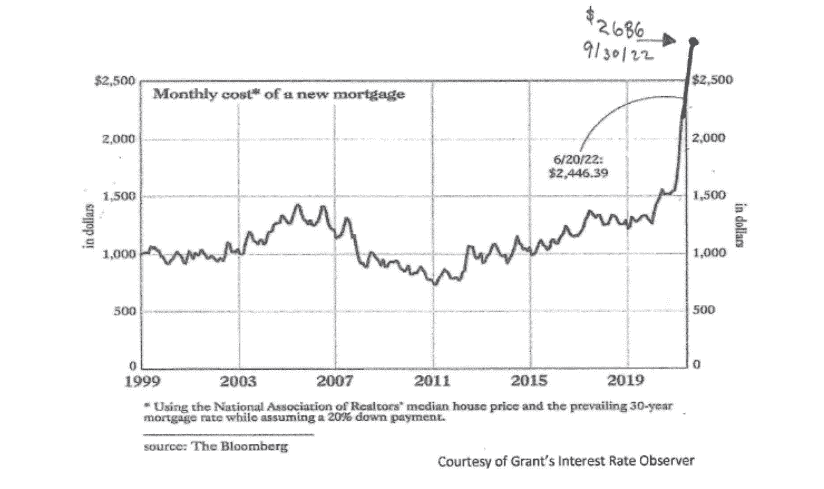
To offer a sense of scale of this shock to the residential housing market, on the next page is a graph courtesy of Grant’s Interest Rate Observer. I have taken the liberty of updating the -lochran line- dollar cost to buy a median priced home at the prevailing mortgage rate.
An 80% increase in the cost to purchase a median priced home, in nine months, cannot occur without significant consequences. With 18% of the economy tied to housing, this is where the “crash” will occur.
Where is the air bag?

This is a screen shot of the Fed Funds 30-day future contracts.
The column on the left is the start date of the next thirty-day average Fed Funds interest rate. The next column is the interest rate expressed as 100 minus the contract price. So, for example, the October 2022 contract is priced at 96.90, which is a rate of 3.10% (100 – 96.90). Notice the November 2022 contract is priced at 3.745% (100 – 96.255) because the market is almost certain the FED will raise rates by 75bps at their next meeting.
In fact, this is how the pundits calculate the odds of an increase. 3.754% minus 3.10% is 65.5bp of a possible 75bp increase, so the market is pricing the odds at 87.3%. [65.5bp / 75bp = 87.3%] Notice the lowest price (and highest yield) is the May 2023 contract at 95.345, which is a yield of 4.655%, almost an exact match to the FEDs 4.60% “DOT Plot” projection for their policy rate.
The market has fully priced that rate level. This is the closing price grid for Monday, September 26, the date the UST two year note was auctioned at 4.29%. I would suggest that unless one thinks the FED will take rates above 4.60% next Spring, this will be the peak for UST 2s.
I am not sure how fast the FED will start to cut rates because CPI will not decline meaningfully for a while; but we are going to be in a full-on hairy recession by then as the housing market will have come to a nearly complete halt.
Closing Comments
Strangely, the war in Ukraine is a bit easier to “game out” now that the Nord Stream pipelines have been sabotaged and will likely be out of commission through the winter; the “degrees of freedom” of the decision tree have been reduced.
Many fingers appropriately point to Putin as the villain, but why would he remove his “optionality” to adjust the gas supply as a bargaining chip during a negotiated settlement; that said, he has made a lot of bad decisions recently.
Logically, it seems the Ukrainians would benefit the most, but I doubt they own a submarine that could navigate to the Baltic Sea undetected. In any case, this destruction is ironically helpful as does finally force everyone to play realpolitik and thus shorten the time to a final denouement.
Last month I suggested there was a chance for a “Soft Landing”, but this was contingent upon the FED exercising some flexibility in their policy process. This notion is now out the window as Mr. Powell has committed to raising rates until inflation abates, not by their models. To paraphrase William Prescott before the Battle of Bunker Hill – Mr. Powell wants to “see the whites of inflation’s eyes”.
Stocks should head lower as earnings come down hard. The $238 earnings at a 15 P/E makes SPX at 3570 sounds fair; but kick the “E” to $210 and 3150 is also rational. Of course, the 15 P/E assumes rates do not breach 4.00%. It is for this reason I have strongly suggested adding a long-dated Payer Swaption Hedging Strategy with a relatively small “modeled” one-year theta decay of 4.6%. [Details at “Fire Insurance – Revisited” – February 2, 2022]

Immodestly, this strategy has delivered an 81.65% Year-to-Q3 total return. I have no idea if long-term rates are going to rise above 4.0%; but if they do, I can assure you financial assets will “power windows down”.
One does not buy car insurance and hope for an accident; similarly, when one buys life insurance, you don’t “win when you die”. You don’t buy a rate hedge because you are bearish on interest rates, you do it because you are bullish and might be wrong.
I think the best ticket in the market presently is AA-rated 22-year 4%-coupon callable Municipal Bonds trading under par plus a payer swaption hedge.
Remember: For most investments, sizing is more important than entry level.
ABOUT HARLEY BASSMAN
Harley Bassman created, marketed and traded a wide variety of derivative and structured products during 26-year career at Merrill Lynch. During his tenure, Harley created the MOVE index, which has become the industry-standard measure of interest rate volatility (and is frequently cited by Keith on our daily "The Macro Show"). Harley was formerly an Executive Vice President & Portfolio Manager at PIMCO.
Harley splits his time between Laguna Beach, California and New York City, and holds a B.A. in management science from the University of California, San Diego and an MBA in finance and marketing from the University of Chicago.
If you would like to be added to Harley's distribution, just ping harley@bassman.net.