Below is a chart and excerpt from today's Early Look written by Macro analyst Ryan Ricci.
|
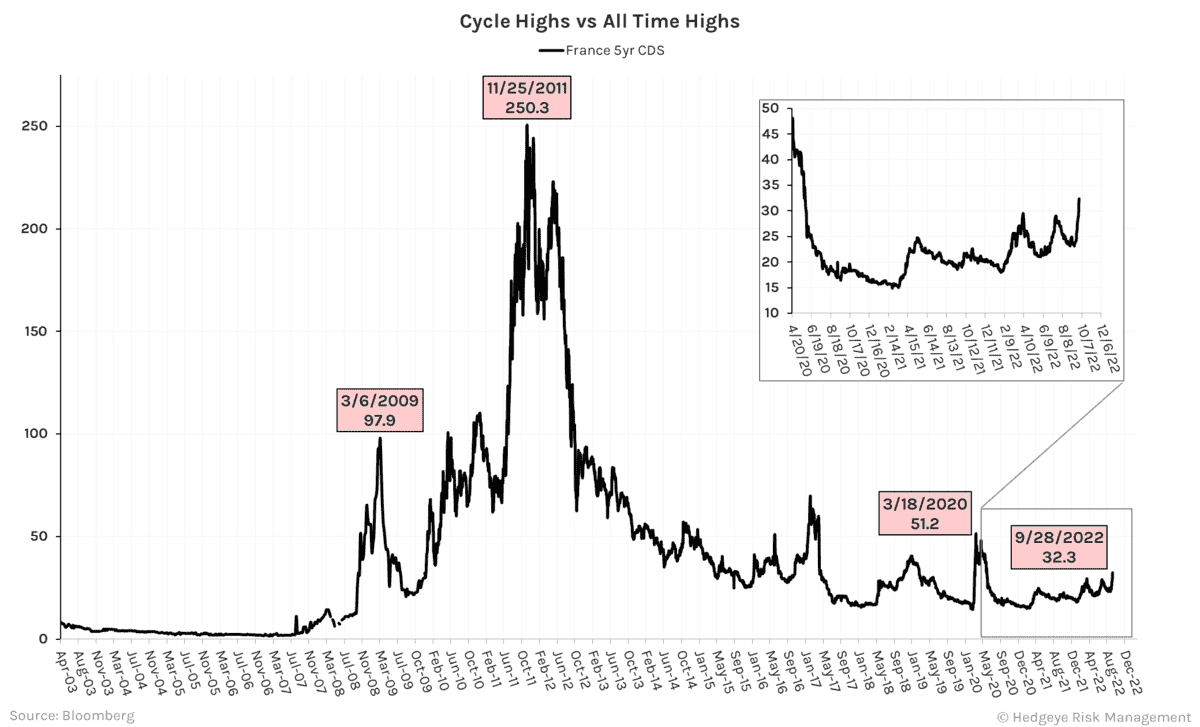
For today, let's just use the Chart of the Day which is looking at France’s historical 5 yr CDS. It is creating cycle highs (32.534), is up 9 bps (+40%) MoM, and up 6 bps (+25%) WoW. This cycle started on 1/28/2022, since then French equities (Cac 40) is down -18%. Now let’s look historically, on 3/11/20 5yr CDS was at the same level it is today and peaked on 3/18/20. The Cac would fall during that time period a further -18.6%. |