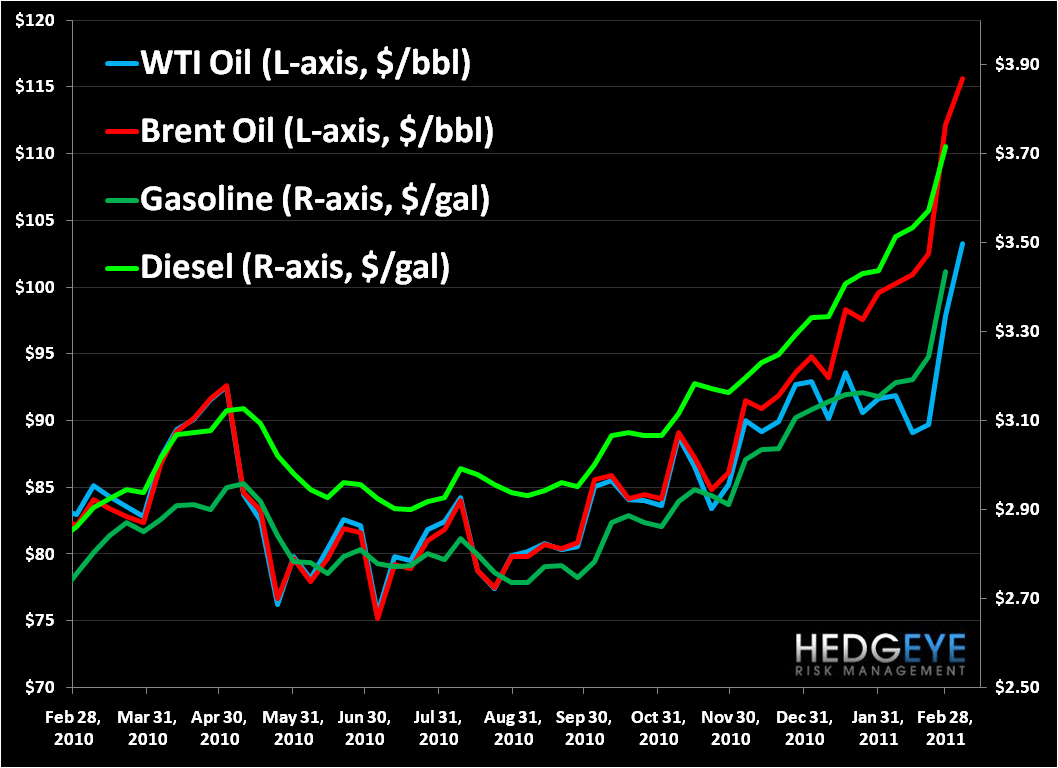
Conclusion: Refined products (gasoline and diesel) in the U.S. are tracking Brent crude oil, and not WTI. If you are using WTI as your marker for oil’s impact on consumers in your macro model, you should reconsider.
Beginning in November 2010, the price of WTI oil began to lag behind other light, sweet oil benchmarks. For many weeks the market was perplexed by the widening spread between WTI and other oils. It was not just Brent that pulled away from WTI, but ALL light, sweet crudes.
Now, the issue is understood well. The glut of crude oil at WTI’s pricing hub – Cushing, OK – is weighing down the price. Additional barrels coming from Canada via the Keystone pipeline and new shale oil plays in the mid-continent, namely the Bakken (ND), Niobrara (WY/CO), and Woodford (OK), are bidding for storage in Cushing. There is no quick solution. Only a pipeline running from Cushing, OK to the Gulf coast will allow WTI to play catch-up to other light, sweet grades, and construction of such a pipeline is nowhere in the foreseeable future. Until then WTI will trade at a considerable discount to comparable crude oils. Currently, the Brent-WTI differential is $12.50/bbl.
Interestingly, the prices of refined products in the U.S. are no longer tracking WTI. When WTI began lagging other oils, gasoline and diesel did not hang back with it. Currently, the correlations between a barrel of WTI crude oil and refined products since Nov 15th, 2010 are:
Gasoline: +0.83
Diesel: +0.69
Over the same duration, the correlations between a barrel of Brent crude oil and refined products are:
Gasoline: +0.98
Brent: +0.98
What is going on here? Well, WTI is the traditional benchmark for oil prices in the United States. Up until a couple a months ago, this worked because all light, sweet crudes traded close to parity. However, now that WTI is at a considerable discount to other oils, the price of WTI is not consistent with the price of oil everywhere in the U.S.
Here is the breakdown of where the U.S. holds its oil:
East Coast (PADD 1) – 3.5%
Midwest (PADD 2) – 30% (which 1/3 of which is Cushing, OK, or 11% of total U.S. stocks)
Gulf Coast (PADD 3) – 48%
Rockies (PADD 4) – 4.5%
West Coast (PADD 5) – 14%

The benchmark oil price is different in each PADD. We contend that the best light, sweet benchmark for each PADD is:
East Coast (PADD 1) – Brent, spot = $115/bbl
Midwest (PADD 2) – WTI, spot = $103/bbl
Gulf Coast (PADD 3) – Light Louisiana, spot = $120/bbl
Rockies (PADD 4) – WTI, spot = $103/bbl
West Coast (PADD 5) – Alaska North Slope (not light and sweet, but really the only crude West Coast refiners run), spot = $115/bbl
The weighted average U.S. light, sweet oil price based on location of the barrels and the benchmark price for each location is $115/bbl – exactly the current price of Brent. This is why the prices of Brent crude oil and refined products in the U.S. have a 0.98 positive correlation.
So, if you were worried about $103 oil squeezing U.S. consumers, how does $115 oil sound?
On the micro, energy level, mid-continent refiners are benefitting from both ends of the refinery gate, with lower feedstock costs, WTI, and higher refined product prices. Our favorites are Holly Corp. (HOC) and Frontier Oil (FTO).
From the Oil and Gas Patch,
Lou Gagliardi
Kevin Kaiser
