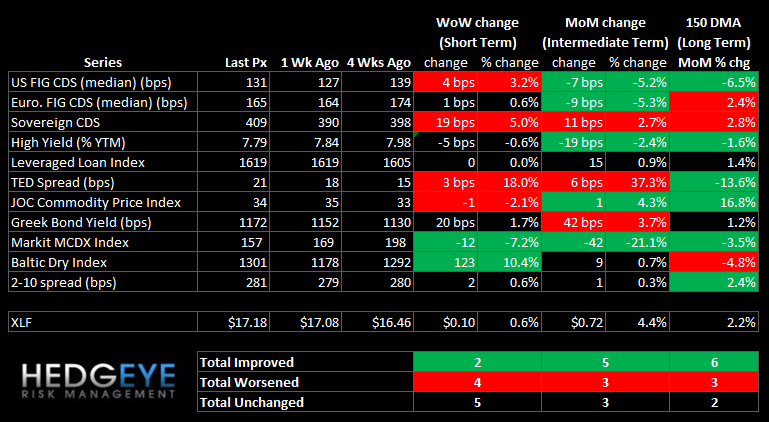
This week's notable callouts are the MCDX municipal swap index breaking lower again, while the TED spread hits its highest level since last August. Among US Financials, COF, AGO and MBI tightened the most week over week, while insurers MET, PRU and HIG widened the most.
Financial Risk Monitor Summary (Across 3 Durations):
- Short-term (WoW): Negative / 2 of 10 improved / 4 out of 10 worsened / 5 of 10 unchanged
- Intermediate-term (MoM): Positive / 5 of 10 improved / 3 of 10 worsened / 3 of 10 unchanged
- Long-term (150 DMA): Positive / 6 of 10 improved / 3 of 10 worsened / 2 of 10 unchanged
1. US Financials CDS Monitor – Swaps were mostly tighter across domestic financials, tightening for 18 of the 28 reference entities and widening for 10.
Tightened the most vs last week: COF, MBI, AGO
Widened the most vs last week: MET, PRU, HIG
Tightened the most vs last month: JPM, COF, XL
Widened the most vs last month: PMI, RDN, GNW

2. European Financials CDS Monitor – Banks swaps in Europe were mostly tighter, tightening for 23 of the 39 reference entities and widening for 15. (One was flat.)

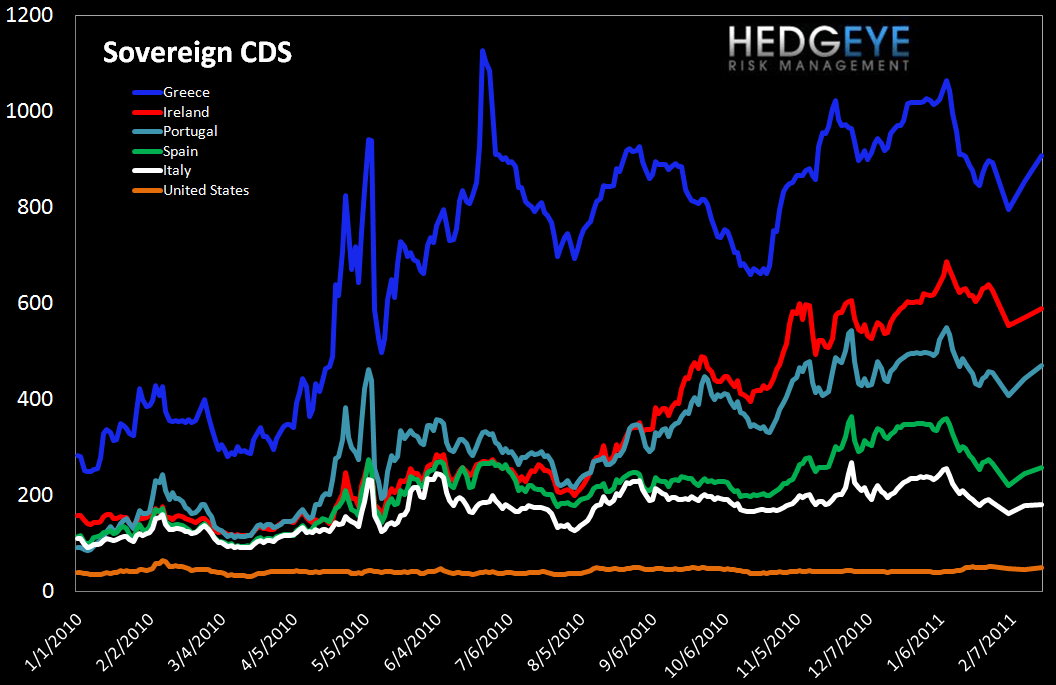
3. Sovereign CDS – Sovereign CDS rose across Europe, climbing 19 bps on average last week.
4. High Yield (YTM) Monitor – High Yield rates fell last week, ending at 7.79, 5 bps lower than the previous week.

5. Leveraged Loan Index Monitor – The Leveraged Loan Index flatlined last week, ending the week at 1619 where it started.

6. TED Spread Monitor – The TED spread backed up last week to its highest level in six months, ending the week at 21 versus 17.8 the prior week.

7. Journal of Commerce Commodity Price Index – Last week, the index held close to flat, falling just under a point to 34 by Friday.

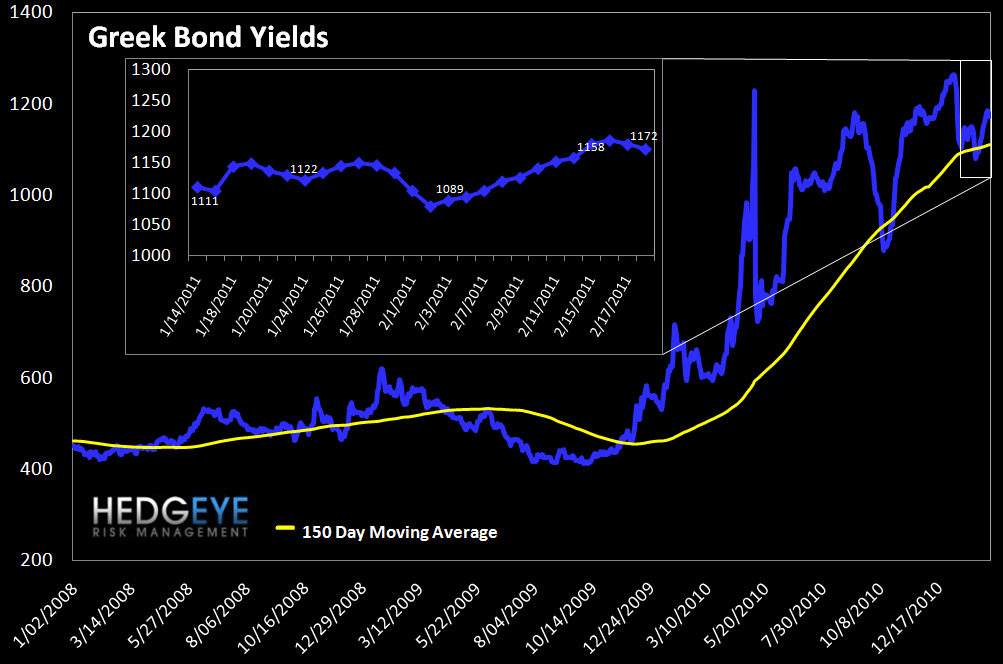
8. Greek Bond Yields Monitor – We chart the 10-year yield on Greek bonds. Last week yields rose 20 bps.
9. Markit MCDX Index Monitor – The Markit MCDX is a measure of municipal credit default swaps. We believe this index is a useful indicator of pressure in state and local governments. Markit publishes index values daily on four 5-year tenor baskets including 50 reference entities each. Each basket includes a diversified pool of revenue and GO bonds from a broad array of states. Our index is the average of their four indices. Spreads fell last week, closing at 157 on Friday, matching their prior low last November.

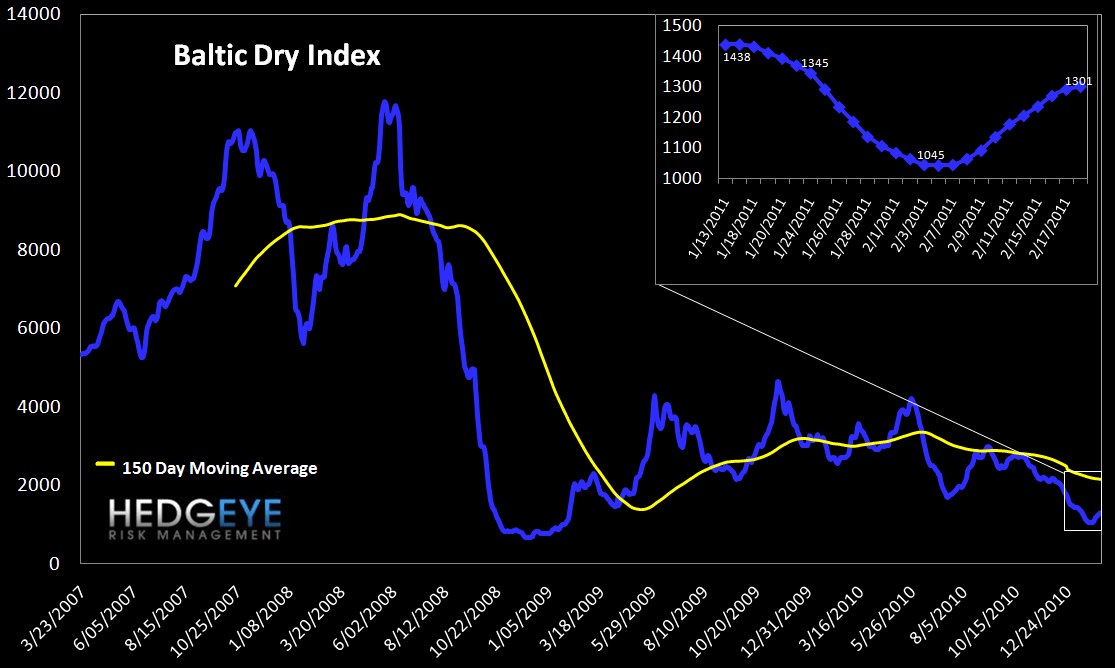
10. Baltic Dry Index – The Baltic Dry Index measures international shipping rates of dry bulk cargo, mostly commodities used for industrial production. Higher demand for such goods, as manifested in higher shipping rates, indicates economic expansion. With Australian floods and oversupply pressuring the Index, it has fallen 30% early in the year, down 60% from its most recent peak. For the last two weeks the BDI has been bouncing off the lows. Last week it rose 123 points to 1301.
11. 2-10 Spread – We track the 2-10 spread as a proxy for bank margins. Last week the 2-10 spread widened very slightly to 281 bps.

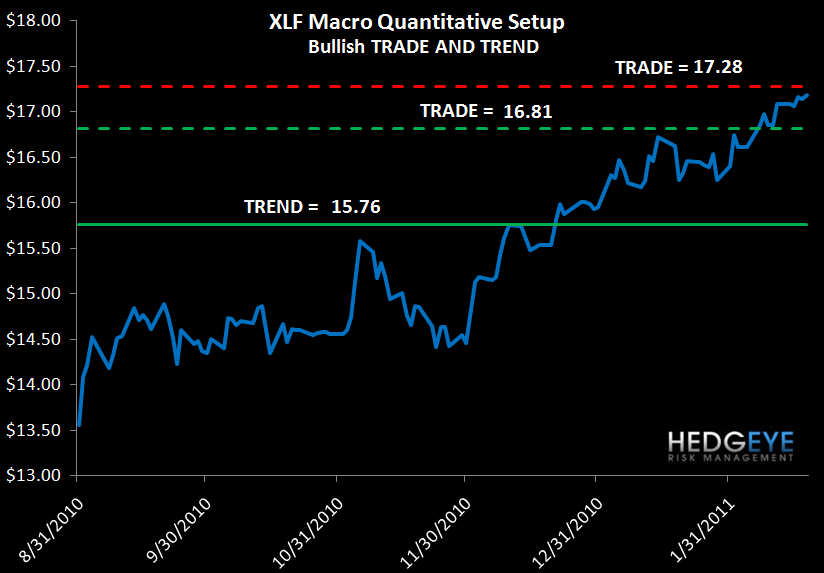
12. XLF Macro Quantitative Setup – Our Macro team sees the setup in the XLF as follows: 0.6% upside to TRADE resistance, -2.1% downside to TRADE support.
Joshua Steiner, CFA
Allison Kaptur