POSITION: no position in SPY
Exhausted yet? I know the US stock market bears are exhausted with the bulls who sold at the exhausted March 2009 lows. As you can see in the chart below, that was 98% lower. The “flows” argument notwithstanding, US Equity market volume, breadth, and volatility readings finally look exhausted too.
Here’s another way to look at the exhaustion of immediate-term TRADE and intermediate-term TREND price momentum:
- Immediate term TRADE’s 3 standard deviation overbought line = 1340
- Intermediate term TREND’s 3 standard deviation overbought line = 1346
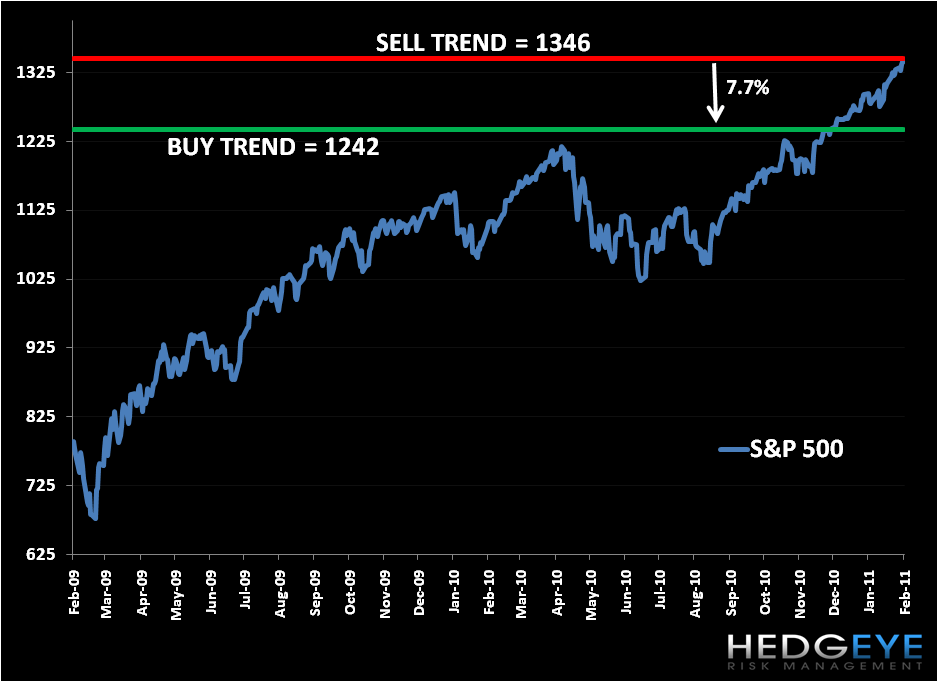
Interestingly, these lines are converging around the same price level. That multi-duration price momentum factor combined with an immediate-term TRADE breakout this week in volatility (VIX) and continued deterioration in our TREND duration volume studies has me exhausted looking at this.
What could go wrong from here to inspire a garden variety mean reversion correction of -7.7% to 1242 over the intermediate-term? Away from a potential crisis in US bond and currency market prices, probably nothing …
I guess the positive news for the bears who had it in them to short today’s highs in the SP500 (I haven’t yet), is that next week doesn’t have a merger Monday. Feels like a February in 2008.
Enjoy your weekend,
KM
Keith R. McCullough
Chief Executive Officer