Below is a chart and brief excerpt from today's Early Look written by Director of Research Daryl Jones.
|
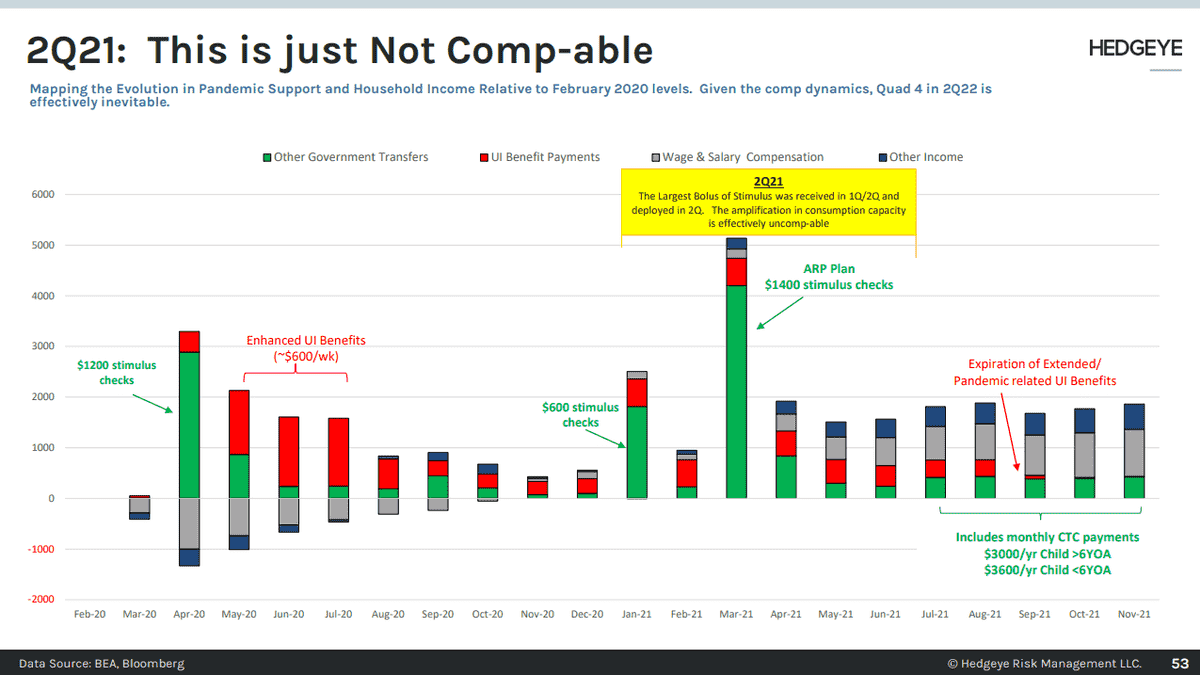
In the Chart of the Day we map out pandemic support and household income relative to February 2020. As the chart shows, we are basically entering a period that is not comp-able due to the largest allotment of stimulus coming in the end of Q1 and early Q2 2022. In fact, as the PCE report showed last week, personal consumption expenditures were up a staggering +15.7% and 19.3% Y/Y for Q1 and Q2 2022, respectively. With consumer spending being roughly 70% of U.S. GDP, that is about to become a headwind real quick . . . especially if the Fed stays on “target”. |