Below is a chart and brief excerpt from today's Early Look written by Macro analyst Christian Drake.
|
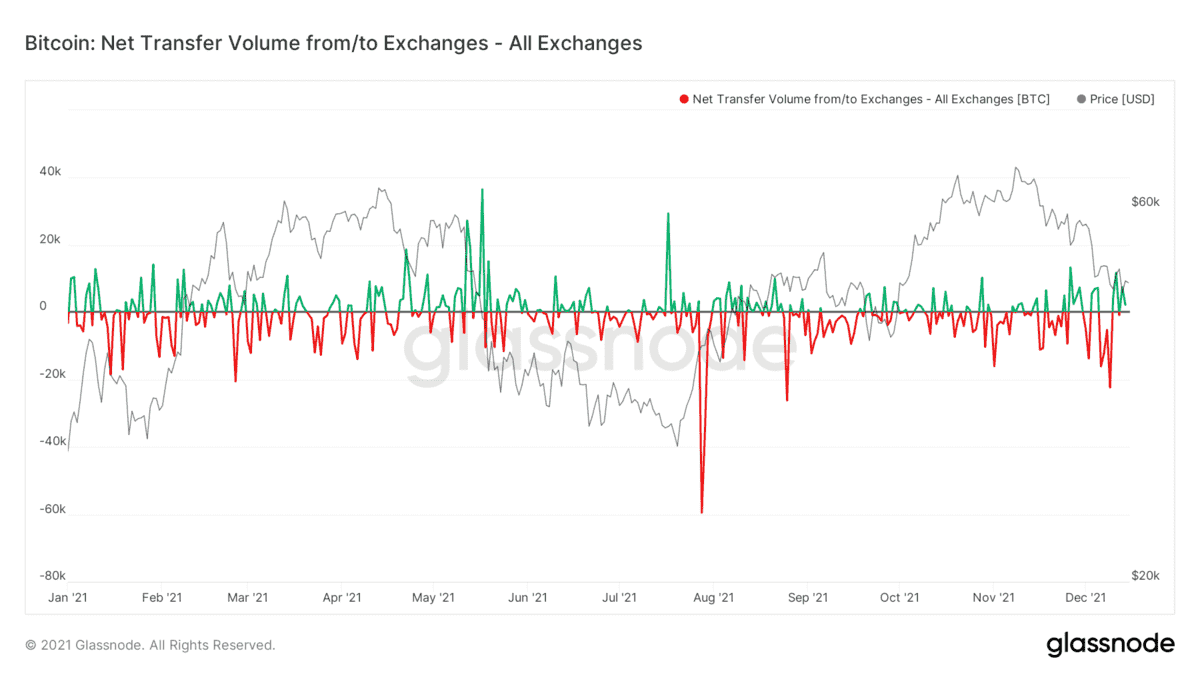
Net Flow Volume and Net Exchange Net Position Change: These measure the difference of volume flowing into exchanges and out of exchanges (i.e. the net flow of coins into/out of exchanges) and the 30 day change of the supply held in exchange wallets, respectively. “What you should be thinking” … You can’t sell it if it’s not for sale. If people want to sell they push their coins onto exchanges and net flows turn persistently positive. The converse is true as well. In the present instance, prices are elevated and people keep pulling BTC off the exchanges which continues to build a supply shock scenario. This comes with a caveat … that is, as defi platforms have proliferated, coins that may have otherwise been left on exchange have been parked elsewhere (to stake or provide liquidity, etc). So, the directional trend remains insightful but it’s not exactly apples to apples looking back across the time series. |