Position: Long corn in our portfolio via the ETF CORN
Conclusion: The global corn supply and demand imbalance looks to persist into 2011 as we are seeing limited demand degradation due to increasing prices.
This has been a tough year for those short of corn. In 2010, world corn production is only up ~2%, while world stocks are down ~2% after declining almost 6% last year. More noteworthy, is that this has been the third year in a row in which consumption has outpaced supply. This shortage has been reflected in the rapid price move in last six months and in the year-to-date on a $ per bushel basis.

In fact, as outlined in the table above, corn has had the most rapid price movement of any of the major grains in 2010. The primary reason for this relates to two factors: weak crop yields in the United States and an inflection point in demand out of China.
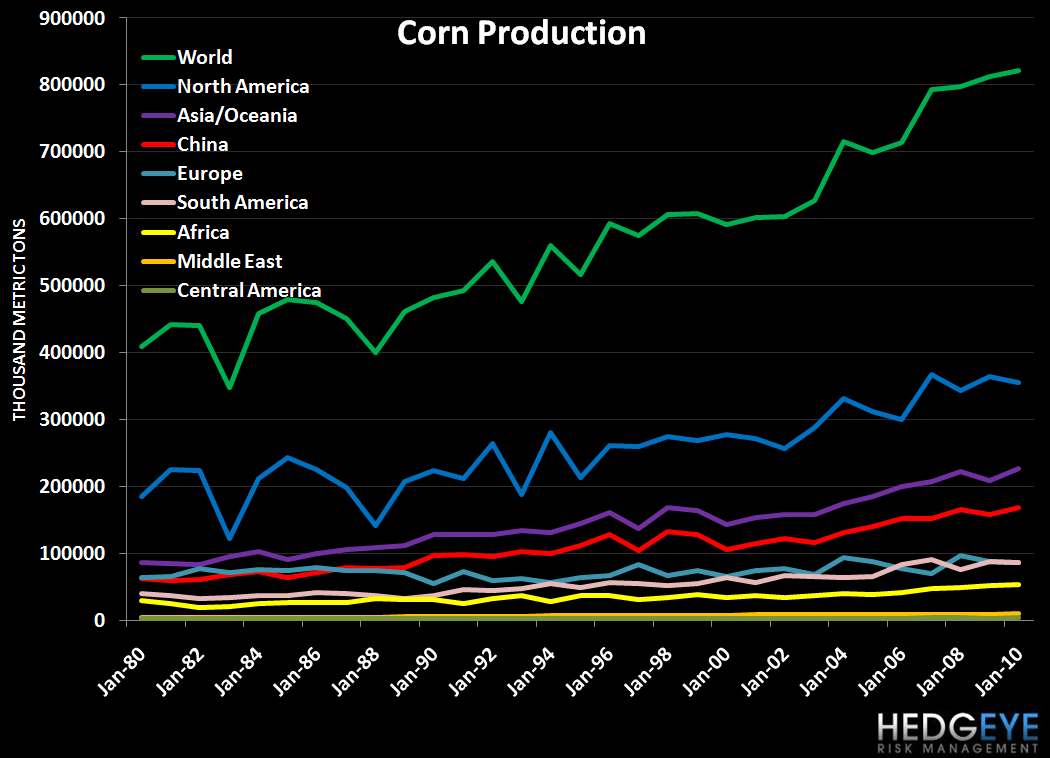
Before moving specifically into these factors, in the chart below we wanted to highlight the history of corn imbalance for the past decade. As the chart shows – while the consumption of corn globally has been growing driven by demographic growth, increased consumption, and the use of corn as an alternative fuel – production shows a slightly different story. In fact, in the last decade we’ve had three shortages of corn, which are driven by the inability of production to keep up with consumption.

In terms of world production share, the United States currently leads the pack. In fiscal 2009, the U.S. grew almost 40% of the world’s corn, and was by far the largest grower, at over 300 metric tonnes. In terms of exporters of corn, the U.S. exports the most corn, with just over 50% of the export market; Argentina is the second largest exporter at about 14% of the export market.
Collectively, the United States and Argentina dominate corn exports. The recent growing seasons in these regions has been weak, which is the critical factor as it relates to global supply and demand, and therefore price. Specifically, Argentina is experiencing very dry weather, which will likely hurt yields for Argentine corn crops as December and January are the key pollination periods. A similar weak growing season in the United States has led to the projection that U.S. corn stocks could drop to the 832 million bushel levels.
As it related to demand from China, the Shanghai JC Intelligence recently increased its estimates for Chinese corn imports to 7.5MM metric tonnes, which was an increase of 22.7% from the groups’ last estimate. This is an important inflection point, since up until last year China was a net exporter of corn and is now potentially poised to become one of the largest importers of the commodity. Chinese corn demand will likely continue to increase despite the threat of monetary tightening, as the government is focused on curbing food inflation domestically and needs to import food stuffs to do this.
Speaking toward global grain demand, the Canadian Wheat Board recently announced that, “domestic demand remains solid, and it remains to be seen how much the price has rationed offshore demand.” This was also verified by the USDA who articulated in their December 10th report that global demand remains strong despite accelerating prices.
Collectively, the combination of resilient grain demand (irrespective of rising prices), difficult growing environments in Argentina and the U.S., and low stock levels in the United States appear poised to continue to drive corn prices higher. In fact, corn stocks have not been this tight since 1, when the current stocks-to-use ratio was also in the 6% range. Put more bluntly, absent demand destruction, we could run out of corn!
It seems the corn bears might be setting themselves up to be corn cobbed…
Daryl Jones
Managing Director
