Below is a chart and brief excerpt from today's Early Look written by Communications analyst Andrew Freedman.
|
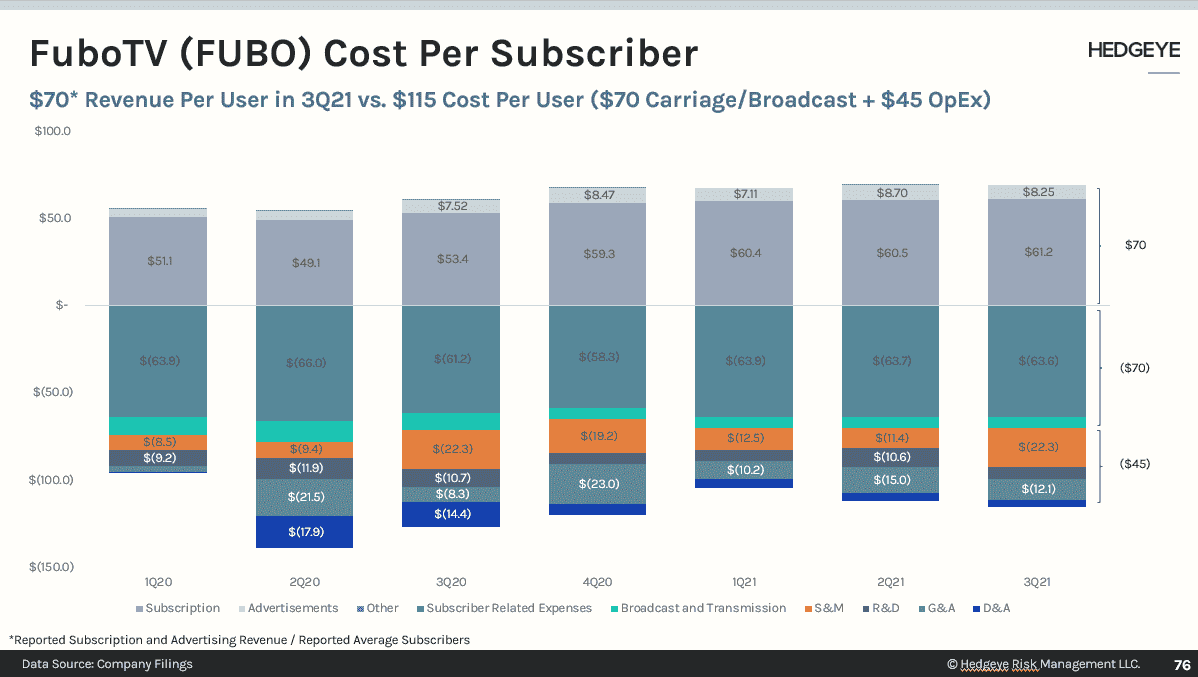
Helping offset some of the subscription costs is FuboTV’s advertising business, which generated $18.5M in revenue in 3Q21 or ~12% of sales. But even if we account for this additional, high-margin revenue stream, the company barely breaks even on the gross profit line. Then we get to layer in the $100M in operating expenses this last quarter, including $50M spent on sales and marketing to acquire subscribers that return less than 0 (LTV / SAC = -0.2 YTD average). Operating losses continue to grow as a result. In 3Q21, operating losses were $103M vs. $81M in Q2 and $65M in Q1. Cash burn increased by 68% to $84M QoQ or annualized $336M versus a cash balance of $393M (the company has been funding losses through an ATM). |