Below is a chart and brief excerpt from today's Early Look written by Director of Research Daryl Jones.
|
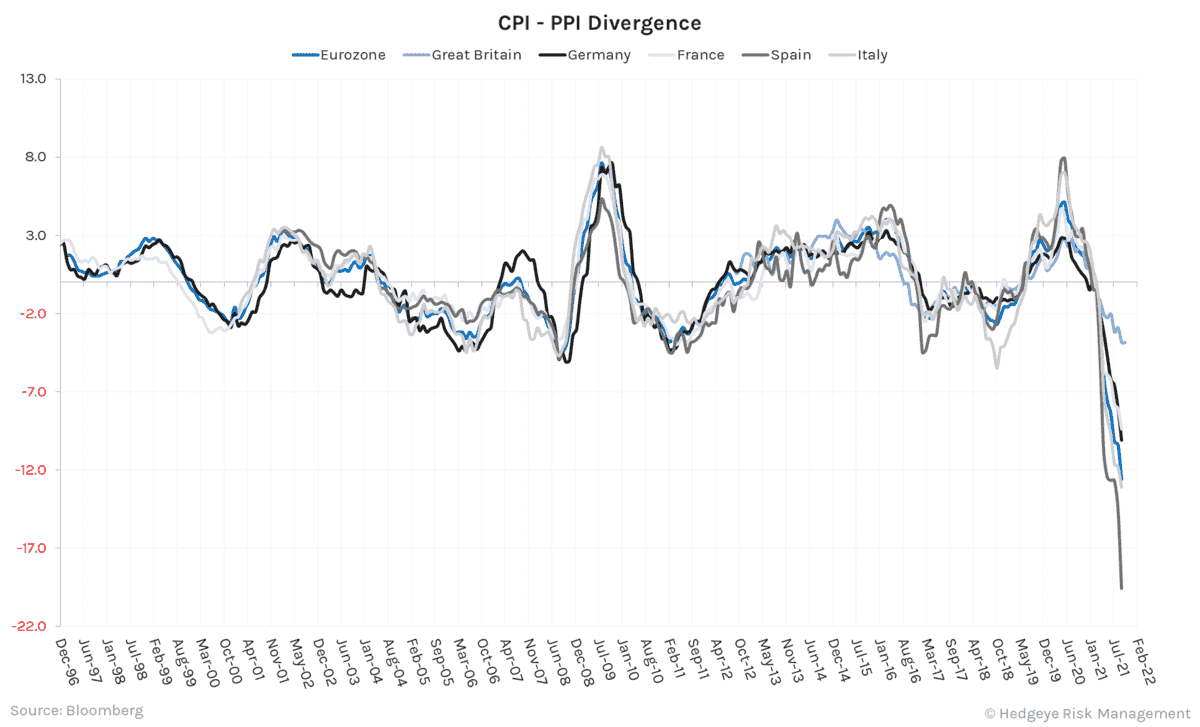
One of the more interesting examples of volatility we’ve been following relates to inflation (no surprise!) and the widening disconnect between CPI (consumer facing inflation) and PPI (producer inflation). Almost anywhere we look around the globe, the spreads between CPI and PPI are currently as wide as they have ever been:
In some instances (like the spike in natural gas in the Eurozone) there are non-trending factors at play. But the reality remains that most of these spreads are 3 – 4 standard deviations beyond the norm. So, while some of these divergences may recede, the leading indicator nature of PPI to CPI will certainly keep the latter elevated. |