Conclusion: Over the past six months, we’ve noticed a high correlation between natural gas and the dollar, though supply and demand fundamentals remain bearish.
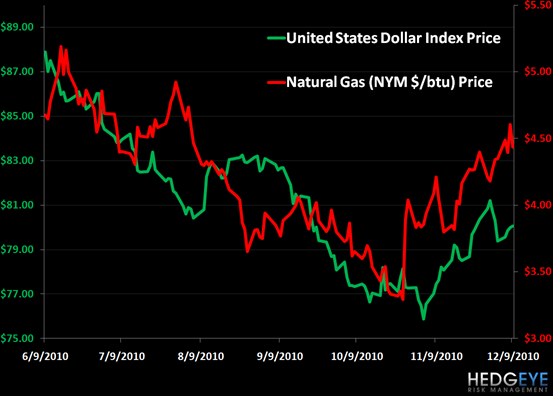
In our internal morning meeting today, we were discussing the recent activity in natural gas. Keith noted that as of late natural gas was moving in lock step with the dollar, so we looked at this relationship over a longer time frame. In the chart below, we’ve charted the U.S. dollar index versus natural gas going back six months. As the chart shows, the correlation between natural gas and the US Dollar Index is high and, in contrast to other commodities, is positive. In fact, we’ve calculated the r squared at +0.71.
Natural gas is an interesting commodity in that it is a localized commodity and priced as such. Specifically, natural gas is very difficult to transport across continents, so it is priced based on local supply and demand. The read through from natural gas being positively correlated with the dollar appears to be that the dollar being strong signals a future strengthening of the U.S. economy. Thus, the price of natural gas increasing may be based on the expectation of a pickup in demand due to accelerating economic growth.
It seems that natural gas might have its own predictive ability, not unlike our friend, Dr. Copper. Unlike copper though, where inventories are low globally, natural gas fundamentals are somewhat bearish currently, specifically:
Supply - Currently, natural gas in storage is 9.8% above the 5-year average with 3,725 Bcf in storage. This is obviously a bearish amount of natural gas in storage, though it is down about 1.5% on year-over-year basis, but remains well above historical norms.
Production – Our energy Sector Head Lou Gagliardi has written about this point extensively, but the growth of production in the United States continues to be one of the most overriding bearish factors for natural gas price. With seemingly little concern for the growth of supply, major E&P companies continue to invest in the natural gas industry in the United States, especially in the various shale plays. In fact production growth is so high, that the Department of Energy is predicting that storage by March 2011 will be 10% above 2010 levels. According to the Department of Energy:
“This month’s STEO expects that in March 2011, inventories of working natural gas in storage will drop to 1,833 Bcf over the winter heating season, falling from its end-of-October level of 3,826 Bcf. This leaves storage levels above the five-year average (2006-2010) end-of-March inventory level of 1,576. The injection season in 2011 will begin with about 10 percent more working gas in storage that it did in March 2010.”
The most recent production data in the United States from September indicated that production was up 7.4% over September 2009, so certainly supports the DOE’s prognostication.
Demand – We’ve been quite vocal as to our expectation of slowing economic growth in the United States in H1 2011 due to tough comps, consumer headwinds, and a lack of future government stimulus. If we are correct in our assessment, it is likely that demand for natural gas could be flat or fall in 2011 versus 2010. In 2009, demand for natural gas was down more than 2% from 2008 levels. Moreover, natural gas is not exactly a growth industry as overall consumption has only grown 9.1% over the 40-year period from 1969 through 2009. The Department of Energy is currently expecting demand to be flat in 2011.
Despite this bearish overhang heading into 2011, in the shorter term we have seen a bit of a bullish inflection point in demand due to the cold weather. In the last week, consumption of natural gas was up 24% from the prior week, which has certainly supported higher prices. The U.S. dollar will also be critical to watch due to its currently high positive correlation, but we will need to see a real pickup in economic activity to offset the looming gas surplus heading into next year.
Daryl G. Jones
Managing Director